QUEBEC CITY, QUEBEC--(Marketwired - Aug. 30, 2017) - Robex Resources Inc. ("Robex" and/or "the Company") (TSX VENTURE:RBX) (FRANKFURT:RB4) is pleased to announce their financial and operating results for the quarter ended June 30, 2017. This second quarter has given encouraging results.
Unless otherwise indicated, all amounts are in Canadian dollars.
Highlights for the second quarter of 2017
- Net cash flows from operating activities(1) of $6.9 million or $0.012 per share1, an increase of 35 % compared with the first quarter of 2017 ($5.1 million or 0,009 $ per share1)
- 8,987 gold ounces sold for $15.2 million, an increase of 22 % compared to the first quarter of 2017 (7,548 gold ounces sold for $12.4 million)
- Total cash costs(2) of $591 per ounce sold and all-included sustaining costs2 of $873 per sold ounce (total cash costs2 of $665 per ounce sold and all-included sustaining costs2 of $891 $ per ounce sold in the first quarter of 2017)
- Adjusted net income attributable to equity shareholders2 of $3.8 million or $0.007 per share2, an increase of 38 % compared to the first quarter of 2017 ($2.7 million or $0.005 per share2)
- 16,525 drilling meters planned at the Nampala mine, starting on October 1st, 70 % of which will be RC drilling and 30 % of core drilling, with the primary objective of increasing the exploitable resources at Nampala
Mining operation: Nampala, Mali
| Second quarters ended June 30, |
First halves ended June 30, |
|||
| 2017 | 2016 | 2017 | 2016 | |
| Operating Data | ||||
| Ore mined (tonnes) | 379,719 | 151,149 | 645,148 | 268,268 |
| Ore processed (tonnes) | 381,710 | 102,998 | 741,919 | 240,418 |
| Waste mined (tonnes) | 615,750 | 316,821 | 1,219,487 | 622,188 |
| Operational stripping ratio | 1.6 | 2.1 | 1.9 | 2.3 |
| Head grade (g/t) | 0.77 | 0.89 | 0.85 | 0.84 |
| Recovery (%) | 85.9 % | 81,8 % | 85,9 % | 83.2 % |
| Gold ounces produced | 8,965 | 2,985 | 16,735 | 3,443 |
| Gold ounces sold | 8,987 | 2,985 | 16,535 | 3,443 |
| Financial Data | ||||
| (all amounts below were rounded to the nearest thousand dollars) | ||||
| Revenues - Gold sales | 15,207,000 | --- | 27,613,000 | --- |
| Mining operation expenses | 4,941,000 | --- | 9,659,000 | --- |
| Change in environmental liabilities | 6,000 | 9,000 | 12,000 | (18,000) |
| Mining royalties | 363,000 | 29,000 | 657,000 | 34,000 |
| Administrative expenses | 1,479,000 | 168 000 | 2,296,000 | 382 000 |
| Depreciation of property, plant and equipment | 1,940,000 | 43,000 | 3,537,000 | 191,000 |
| Segment operating income | 6,478,000 | (249,000) | 11,451,000 | (589,000) |
| Statistics3 | ||||
| (all amounts below are expressed in dollars) | ||||
| Average realized selling price (per ounce) | 1,692 | --- | 1,670 | --- |
| Cash operating cost (per tonne processed)4 | 11 | --- | 12 | --- |
| Total cash cost (per ounce sold)4 | 591 | --- | 625 | --- |
| All-in sustaining cost (per ounce sold)4 | 873 | --- | 881 | --- |
| Administrative expenses (per ounce sold) | 165 | --- | 139 | --- |
| Depreciation of property, plant and equipment (per ounce sold) | 216 | --- | 214 | --- |
Exploration
Nampala Mining site
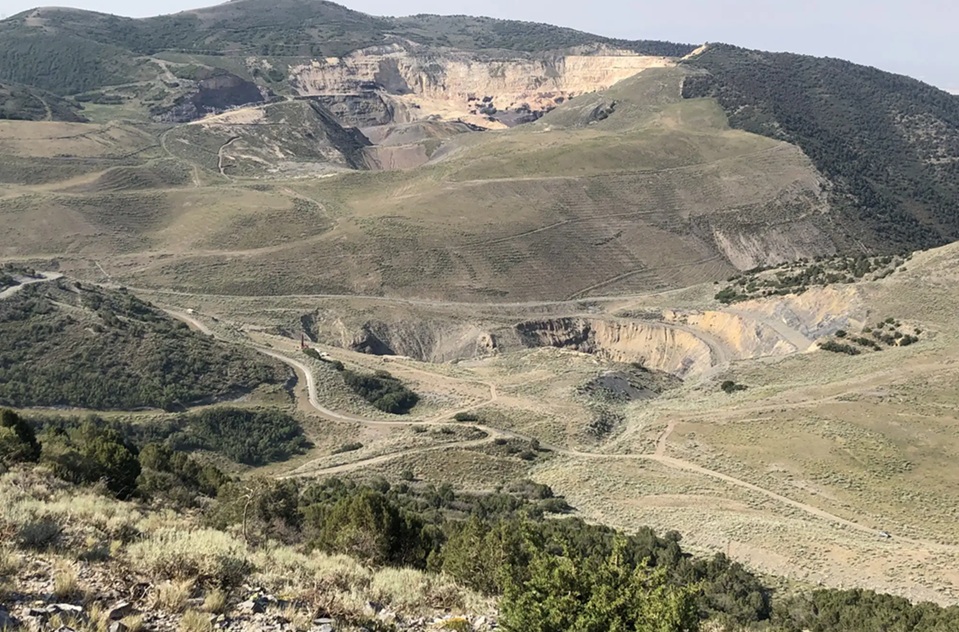
The drilling program has been fully planned and includes 4,750 meters of core drilling and 11,775 meters of reverse circulation ("RC") drilling. The drillings will begin once the rainy season is over, around October 1st, 2017 and will take place in the last quarter of 2017.
ROBEX's Management's Discussion and Analysis and Consolidated Financial Statements are available on the Company's website in the Investor section at: Robexgold.com. These reports and other documents produced by the Company are also available at: Sedar.com.
| 1 | Cash flows from operating activities exclude changes in non-cash working capital items. |
| 2 | Operating cash flows per share, total cash costs, all-in sustaining cost and adjusted net income attributable to equity shareholders are non-IFRS financial performance measures with no standard definition under IFRS. See the "Non-IFRS financial measures" section of MD&A, on page 32. |
| 3 | The statistics relate entirely to the mining operations of the Nampala mine. As the mine was not in commercial operation in 2016, the comparative does not apply for this period. |
| 4 | Cash operating cost, total cash cost and all-in sustaining costs are non-IFRS financial performance measures with no standard definition under IFRS. See the "Non-IFRS financial measures" section of MD&A, on page 32. |


