- NPV7% of $4.18 Billion After-tax IRR of 34.2% at $4.30/lb Copper / $2,150 Gold 1.9 year Payback of Initial Capital Costs Initial Capital Estimate of $2.37 Billion After-tax Benefit Cost Ratio of 1.8
- Reserve Estimate of 960 million Tonnes 849 million Tonnes of Proven and Probable Milling Reserves and 111 million Tonnes of Proven and Probable Leaching Reserves
- Material Regulatory Approvals in Place
- Equivalent Mill Copper Grade of 0.83% for the First Five Years of Milling and 0.58% for the First Twenty Years of Milling
- Payable Copper and Gold Production is Estimated to be 4.4 billion Pounds (2.0 million tonnes) and 6.9 million ounces (214,000 kilograms) over a 38-Year Mine/Process Life, with Cash Costs of $2.06 per Equivalent Pound of Copper and C1 Cash Costs of $0.32 per Pound of Copper Net of Gold Credits
- Annual Production Average in the first 5 years will be 284 million Pounds (129,000 tonnes) of Payable Copper in cathode and concentrate and 333,000 Ounces (10,340 kilograms) of Payable Gold in Concentrate and Doré metal
- Total MPSA Tenement and Land Area St. Augustine Controls for Development has been increased from 1,656 Hectares to Greater than 2,976 Hectares.
- Planned Tradeoff and Optimization Studies Focus on Chloride Leach to support Low Grade Sulfide Stockpile Copper production at the beginning of mine life / Improved Mill Recoveries / Improved Crushing and Grinding Circuit efficiency for levelized mill throughput at total plant capacity
- St. Augustine plans to move the large scale open pit Kingking project through Definitive Feasibility and into production on an optimized schedule
Manila, Philippines--(Newsfile Corp. - July 31, 2025) - St. Augustine Gold and Copper Limited (TSX: SAU) ("St. Augustine" or the "Company") is pleased to announce the results of the updated Preliminary Feasibility Study ("PFS") of the Kingking Copper-Gold Project located in Pantukan, Davao de Oro, Philippines. The updated Pre-Feasibility Study allows the Company to initiate work on the Definitive Feasibility Study and expedite the start of construction. The results of the PFS demonstrate extremely robust economics, generating an estimated post-tax net present value ("NPV") of $4.18 billion and internal rate of return ("IRR") of 34.2%. The benefit-cost ratio (BCR) is 1.8.1
The Company's senior management team led by Mr. Michael G. Regino, Chief Operating Officer, Mr. Andrew J. Russell, Project Director, and Mr. Nico Paraskevas, Executive Director, completed the effort over the last 14 months.
Mr. Regino commented: "The update to the Pre-Feasibility Study for Kingking is a long-awaited milestone for our shareholders, especially in the context of recent changes to the Philippine mining regulatory structure which have paved the way for a world class project development. The benefit of the project to the Philippine economy as well as the local communities cannot be overstated. The location in Southeast Asia is enviable with direct ship access to the largest copper market on earth. We look forward to participating in these critical metals supply chains."
Mr. Regino further stated: "The first 5 years of Kingking gold production will make it one of the top 25 worldwide gold producers at more than 333,000 oz per year, excluding its substantial copper production. The combined copper and gold production brings Kingking into the top 10 copper producing mines on a copper equivalent basis at more than 204,000 equivalent tonnes per year."
The Company believes that following completion of the update to the PFS, the opportunity to move the Kingking project through the Definitive Feasibility process and into production can soon be realized. Mr. Russell noted, "This project will produce copper net of by-product credits at one of the lowest rates of any operation worldwide. The tradeoff studies and recommendations provide a clear path to improved efficiencies, levelized production, and operational excellence. We have some of the world's best engineering firms supporting us in this endeavor."
Mr. Paraskevas further stated: "Open pit mining projects of the scale of Kingking are rare, and even more so considering that the Kingking project has substantially completed applicable permitting requirements and is essentially shovel ready. We are very pleased with the results of the Preliminary Feasibility Study, which confirm the strong technical and economic potential of our Kingking project. These results reinforce our confidence in delivering value to our stakeholders and further demonstrate the significant opportunity that Kingking represents for the region and our shareholders. We look forward to advancing the project towards a definitive feasibility study and continuing our engagement with stakeholders and partners as we progress."
Permitting Status
The Environmental Impact Statement (EIS) and Declaration of Mine Project Feasibility ("DMPF") were submitted to the Philippine Government in 2012. The Environmental Compliance Certificate (ECC) was granted in February 2015 (EIS approval) and Declaration of Mining Project Feasibility (DMPF) was approved in January 2016. The Company has confirmed with the Mines and Geosciences Bureau (MGB) and Environmental Management Bureau (EMB) that the DMPF and ECC are in good standing. Additionally, as required by the EMB, the Company has secured ISO 14001: 2015 Certification for Environmental Management System (EMS) in 2018, which remains valid. The Mineral Processing Permit (MPP) is currently lapsed because of the Company's inability to proceed to the development of the Kingking Project due to a combination of regulatory restrictions, including the 2017 open pit mining ban which was only lifted in late December 2021, and the operational disruptions caused by the COVID-19 pandemic. These unforeseen events significantly delayed the commencement of the Kingking Project. The Company is now actively working to complete the requirements to secure the renewal of its MPP.
Key Project Indicators for the First 23 years of Project Life are illustrated below: Mine development and construction start in Year 1 and continues into Year 2 with some heap leach ore stockpiled. Heap Leach and SX-EW construction complete in Year 2 and SX-EW cathode is produced in Year 3. Mill construction is completed in Year 3, and copper-gold concentrate is produced in Year 4. Gold Doré bars from gravity concentrate are produced starting in Year 4.
Average annual production during the first five years is projected at 284 million pounds (129,000 tonnes) of payable copper-produced as cathode and concentrate-and 333,000 ounces (10,340 kilograms) of payable gold in concentrate and doré. All cathode production is 100% payable, while copper concentrate payability is subject to standard market smelter terms, typically ranging from 96.5% to 98%, which have already been factored into the project valuation.
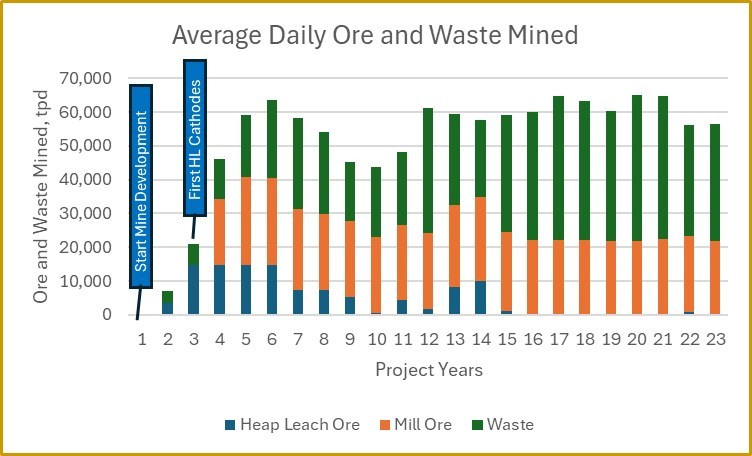 Figure 1 - Annual Mining of Ore and Waste, LOM W:O Ratio 0.872
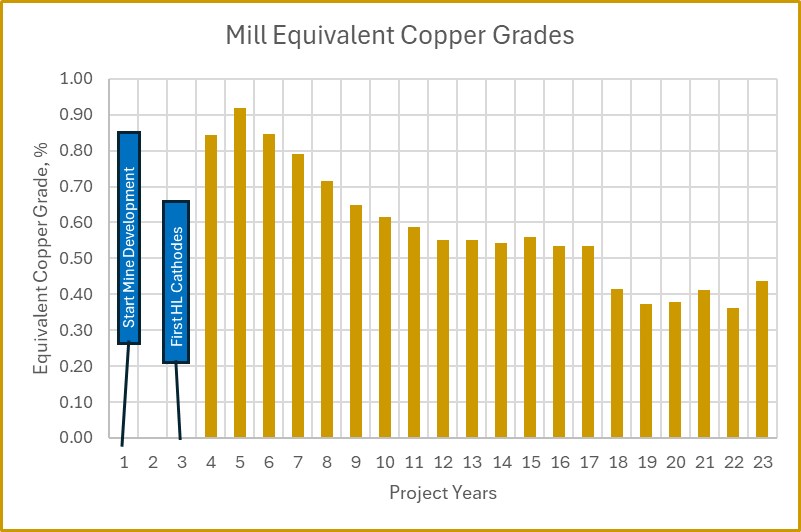 Figure 2 - Annual Mill Equivalent Copper Ore Grade, 0.83% for First 5-Years3
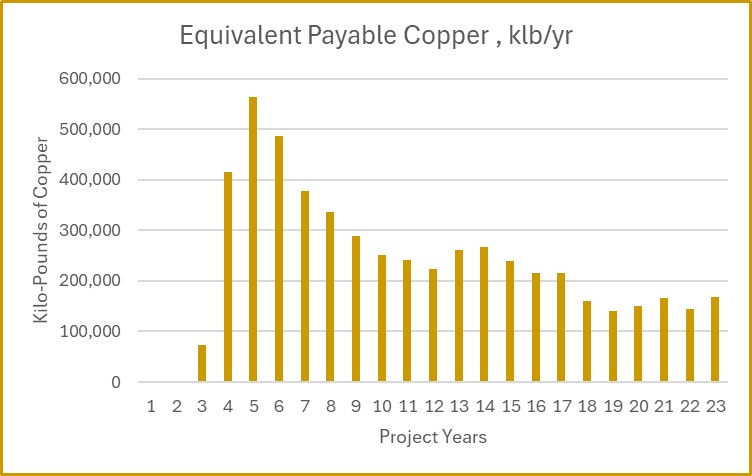 Figure 3 - Annual Equivalent Pounds of Payable Cu, Averages 436 million lbs. for Years 4-84
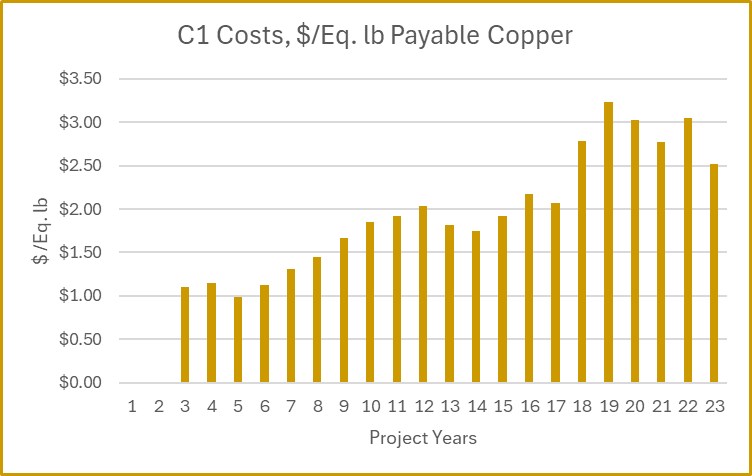 Figure 4 - Annual C1 Costs, USD (2024 figures) per Pound of Equivalent Payable Copper5
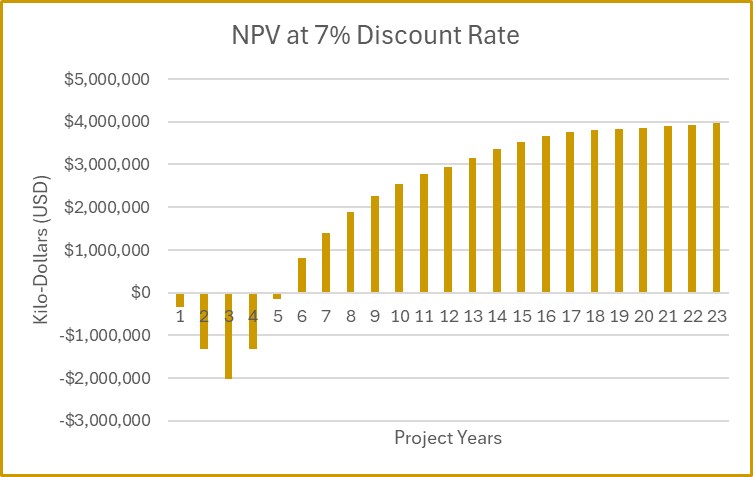 Figure 5 - Cumulative, by year, Net Present Value at 7% Discount Rate, Shows Rapid Project Payback
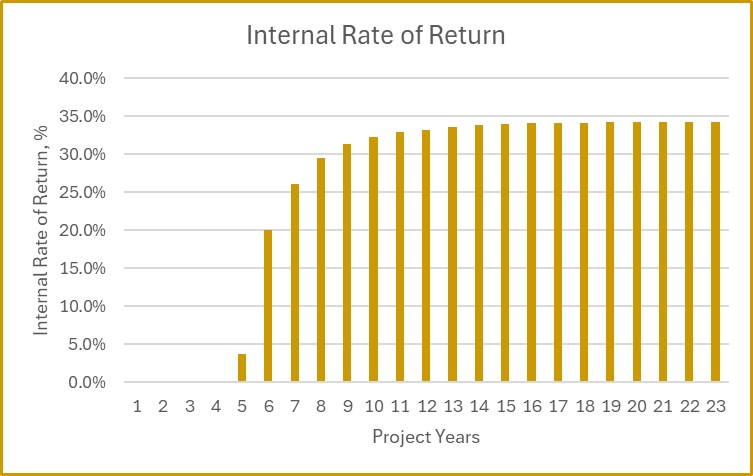 Figure 6 - Cumulative, by year, Project Internal Rate of Return, Large Rapid Project Return on Investment
The PFS was prepared by M3 Engineering & Technology Corporation of Tucson, Arizona ("M3"). The resource, reserve, mine plan, mine operating costs and mine capital costs were developed by Independent Mining Consultants Inc. ("IMC") of Tucson, Arizona. M3 evaluated mineral process testing, provided process and infrastructure designs, and estimated operating and capital costs for the rest of the project outside of the mining area. The Company will file the full NI 43-101 technical report on SEDAR+ and the Company's website within 45 days. All dollar figures in this news release are in 2024 USD.
Reserve Base
The table below presents the mineral reserve for the Kingking Project based on the mine and plant production schedules developed for the study. The mineral reserve amounts to 849 million tonnes of proven and probable milling reserves grading 0.26% copper and 0.36 g/t gold, and 111 million tonnes of proven and probable leaching reserves grading 0.23% copper. The equivalent copper grade of the life of mine milling reserve is 0.48% and it averages 0.83% equivalent copper for the first five years of milling ore.6
Table 1 - Mineral Reserve
| Mineral Reserve (Milling): | Tonnes Mt |
NSR ($/t) |
Tot Cu (%) |
Sol Cu (%) |
Gold (g/t) |
Copper (Mlbs) |
Gold (Koz) |
| Proven Mineral Reserve: | 142.3 | 37.83 | 0.33 | 0.12 | 0.49 | 1,037 | 2,253 |
| Oxide Mill Ore | 45.4 | 58.56 | 0.52 | 0.30 | 0.71 | 516 | 1,033 |
| Sulfide Mill Ore | 76.5 | 31.90 | 0.26 | 0.04 | 0.45 | 444 | 1,117 |
| Low Grade Stockpile | 20.4 | 13.93 | 0.17 | 0.02 | 0.16 | 78 | 103 |
| Probable Mineral Reserve: | 706.5 | 25.51 | 0.24 | 0.04 | 0.33 | 3,803 | 7,519 |
| Oxide Mill Ore | 52.0 | 43.46 | 0.36 | 0.21 | 0.59 | 412 | 986 |
| Sulfide Mill Ore | 499.7 | 27.08 | 0.25 | 0.03 | 0.36 | 2,776 | 5,751 |
| Low Grade Stockpile | 154.9 | 14.43 | 0.18 | 0.02 | 0.16 | 615 | 782 |
| Proven/Probable Reserve: | 848.9 | 27.57 | 0.26 | 0.06 | 0.36 | 4,840 | 9,771 |
| Oxide Mill Ore | 97.4 | 50.50 | 0.43 | 0.25 | 0.64 | 928 | 2,018 |
| Sulfide Mill Ore | 576.2 | 27.72 | 0.25 | 0.03 | 0.37 | 3,220 | 6,868 |
| Low Grade Stockpile | 175.3 | 14.37 | 0.18 | 0.02 | 0.16 | 692 | 885 |
| Mineral Reserve (Leaching): | Tonnes Mt |
NSR ($/t) |
Tot Cu (%) |
Sol Cu (%) |
Gold (g/t) |
Copper (Mlbs) |
Gold (Koz) |
| Proven Mineral Reserve | 50.2 | 14.97 | 0.25 | 0.16 | N.A. | 275 | N.A. |
| Probable Mineral Reserve | 60.4 | 12.22 | 0.21 | 0.12 | N.A. | 280 | N.A. |
| Prov/Prob Leach Reserve | 110.5 | 13.47 | 0.23 | 0.14 | N.A. | 555 | N.A. |
| Copper Mineral Reserve Milling and Leaching |
Tonnes Mt |
NSR ($/t) |
Tot Cu (%) |
Sol Cu (%) |
Gold (g/t) |
Copper (Mlbs) |
Gold (Koz) |
| Proven/Probable Reserve | 959.4 | 25.95 | 0.26 | 0.06 | N.A. | 5,396 | N.A. |
| Proven Mineral Reserve | 192.5 | 31.87 | 0.31 | 0.13 | N.A. | 1,312 | N.A. |
| Probable Mineral Reserve | 766.9 | 24.46 | 0.24 | 0.05 | N.A. | 4,083 | N.A. |
Mining Schedule
The PFS assumes a base case ore delivery rate of 100,000 tpd considering 40 ktpd to an on-off heap leach and 60 ktpd to mill. IMC prepared a 31-year mine plan followed by 7 years of processing stockpiled ore. Heap leach ore declines in year 7 and is much reduced after year 15. The mine schedule excludes inferred mineral resources, which are waste in the mine reserve analysis. The mine schedule has six development phases and is optimized for metals production at the mill while maintaining low waste to ore ratio in the early years. The availability of high quantities of near surface copper oxide leachable material in the early years reduces the pre-stripping to 9,800 tonnes of waste and allows for early development for copper heap leach processing, which starts in year 3, approximately 1 year before the mill starts. A mill ore stockpile near the crusher of 175 million tonnes of low-grade sulfide ore (0.179% Cu and 0.157 Au) supports 7 years of additional mill ore processing post mining operations. The table below provides a summary of the plant production, and illustrates the higher metal grades and lower waste /ore ratio achieved early in the mine life:
Table 2 - Production Summary
| First 5 Years | Life of Mine | ||
| Processed Tonnes | Mill | 96 million* | 849 million |
| Heap Leach | 69 million | 111 million | |
| Copper (%) | Mill | 0.49 | 0.26 |
| Heap Leach | 0.26 | 0.23 | |
| Gold (g/tonne) | Mill | 0.67 | 0.36 |
| Waste to Ore Ratio | 0.54 | 0.87 |
*Four years of mill production. Mill plant starts one year after heap leach.
Development Overview
The proposed open pit mine and processing plant will produce copper/gold concentrate, copper cathode, and gold Doré bullion. Ore will be transported from the primary crusher located near the mine to the mill and heap leach area by aerial conveyor. Higher-grade oxide dominant ore containing above cutoff grade gold and all sulfide ore will be treated in a concentrator at 60,000 tpd. The concentrator process will consist of crushing, grinding, gravity concentration of free gold, and flotation of sulfide copper and gold to concentrate. An agitated leach circuit will leach oxide copper from mill flotation tails. Oxide ore containing little or no gold, below cutoff grade, will be treated in a heap leach at 40,000 tpd. The heap leach process will consist of crushing, agglomeration, and leaching utilizing on-off cells. Pregnant solutions from the mill agitated leach and heap leach processes will report to a common SX-EW facility for production of cathode copper. Milling copper recoveries of 85% are expected to be achieved through a combination of solvent extraction and electrowinning ("SX/EW", 23%) and conventional froth flotation (62%). Milling gold recovery is expected to be 72% through a combination of intensive leaching of gravity concentrate (20%) and froth flotation (52%). Heap leaching copper recovery by SX-EW is expected to be 79%. Total life of mine metal production for the dual processing case (heap leach and mill) is 4.4 billion pounds of copper (2.0 million tonnes), and 6.9 million ounces gold (214,000 kilograms). A dry stack tailing facility, engineered for wet environments, is proposed for handling tailings from the process plant. Construction of a new 32-kilometer power line is proposed to connect to the national grid. Capacity has been assessed well above the project load.
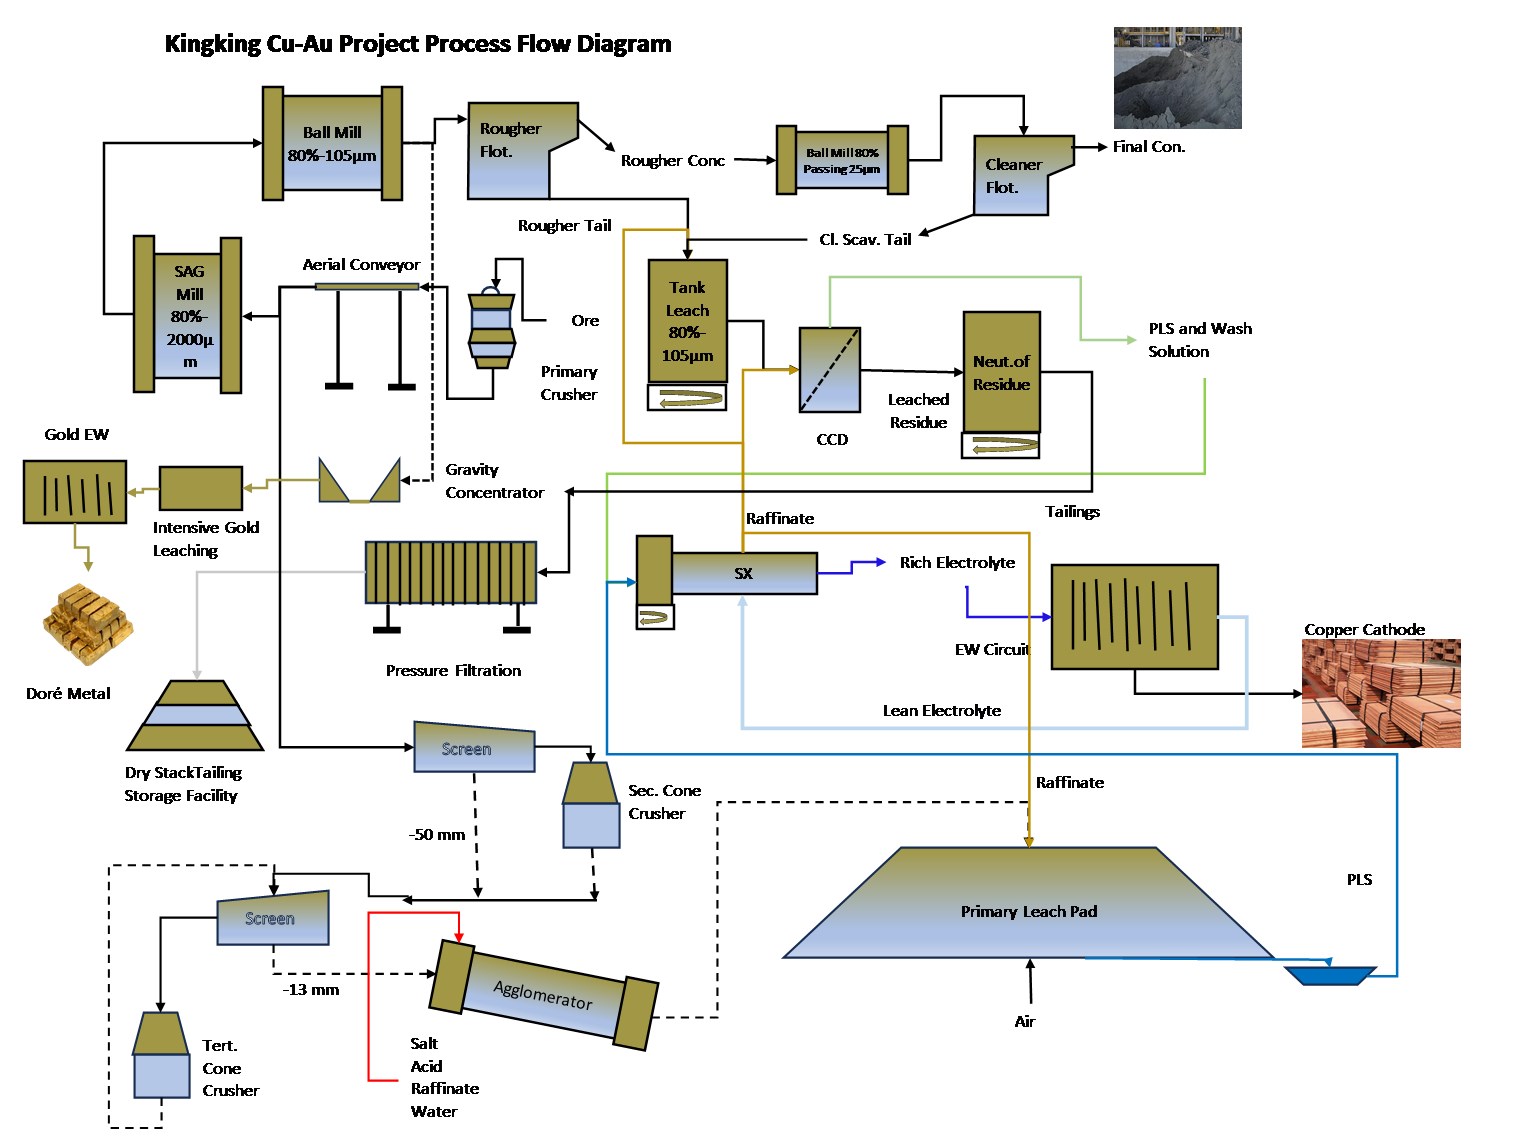 Figure 7 - Kingking Cu-Au Project Process Flow Diagram
Production Rates, Capital Costs, Operating Costs, Metal Prices and Financial Valuation
Project production, capital and operating costs, metal prices, financials and sensitivities are shown in the table below.
Table 3 - Project Production, Costs, Metal Prices, Financials, and Sensitivities
| Base Case - 40ktpd Leach / 60ktpd Mill 31-yr Open Pit followed by 7-yr Sulfide Stockpile |
Base Case | 20% Higher Metal Prices Case 1 |
20% Higher OPEX Costs Case 2 |
20% Higher CAPEX Costs Case 3 |
|
| Ore Production Rate LOM (ktonnes/day) | 69 | 69 | 69 | 69 | |
| Projected Mine Life (yrs) | 38 | 38 | 38 | 38 | |
| Metal Price Assumptions | |||||
| Copper ($/lb) | 4.30 | 5.16 | 4.30 | 4.30 | |
| Gold ($/oz.) | 2,150 | 2,580 | 2,150 | 2,150 | |
| Average Annual Production | |||||
| Gold |
(oz.) (kg) |
185,828 5,780 |
185,828 5,780 |
185,828 5,780 |
185,828 5,780 |
| Copper |
(thousand lbs.) (metric tons) |
119,633 54,265 |
119,633 54,265 |
119,633 54,265 |
119,633 54,265 |
| Copper Equivalent |
(thousand lbs.) (metric tons) |
212,547 96,411 |
212,547 96,411 |
212,547 96,411 |
212,547 96,411 |
| LOM Revenue ($000) | |||||
| Gold | $14,780,096 | $17,736,115 | $14,780,096 | $14,780,096 | |
| Copper | $19,031,092 | $22,837,310 | $19,031,092 | $19,031,092 | |
| Less Treatment and Refining Charges | $(960,227) | $(977,082) | $(960,227) | $(960,227) | |
| Total Revenue | $32,850,960 | $39,596,343 | $32,850,960 | $32,850,960 | |
| Avg. Annual Net Cash Flow ($000) Pre-Tax | $290,421 | $ 456,929 | $205,808 | $277,441 | |
| LOM Total Net Cash Flow ($000) Pre-Tax | $11,036,017 | $17,363,291 | $7,820,703 | $10,542,744 | |
| Initial Capital ($000) | $2,373,784 | $2,373,784 | $2,373,784 | $2,848,541 | |
| Sustaining Capital ($000) | $798,412 | $798,412 | $798,412 | $798,412 | |
| LOM Operating Costs | |||||
| Mining Cost ($/tonne mined) /($/tonne ore)* | 2.30/4.31 | 2.30/4.31 | 2.76/5.17 | 2.30/4.31 | |
| Process Plants Operating Cost ($/tonne ore) | 10.42 | 10.42 | 12.51 | 10.42 | |
| General Administration ($/tonne ore) | 1.15 | 1.15 | 1.38 | 1.15 | |
| Other ($/tonne ore) | 0.23 | 0.23 | 0.28 | 0.23 | |
| Total Operating Cost ($/ tonne ore) | 16.11 | 16.11 | 19.34 | 16.11 | |
| C1 Cost/ Copper Equivalent lb. | $2.06 | $2.06 | $2.45 | $2.06 | |
| C1 Cost / lb. Copper net of by products | $0.32 | $(0.34) | $1.01 | $0.32 | |
| Pre-Tax Economic Indicators | |||||
| NPV @ 7% ($000) | $4,287,508 | $6,707,098 | $3,296,006 | $3,863,157 | |
| IRR (%) | 34.2% | 44.5% | 30.8% | 28.1% | |
| Payback (yrs) | 1.9 | 1.5 | 2.0 | 2.2 | |
| After-Tax Economic Indicators** | |||||
| NPV @ 7% ($000) | $4,181,607 | $6,518,992 | $3,236,572 | $3,759,718 | |
| IRR (%) | 34.2% | 44.5% | 30.7% | 28.1% | |
| Payback (yrs) | 1.9 | 1.5 | 2.0 | 2.2 | |
*Mine operating costs reflect higher cost contract mining.
**Assumes an income tax holiday for the first ten years of the project
Opportunities
Opportunities to improve project economics are being evaluated to be considered in the Definitive Feasibility Study. These include the following:
-
Chloride leach of low-grade sulfide stockpile on the leach pad which will allow for recovery of metals much earlier in the mine life and associated cash flows. Additional assessment of extending leach pad life through processing only higher grades in the mill.
-
Grinding efficiency assessment to eliminate ore hardness throughput constraint. This may include additional ball mill capacity at appropriate interval or use of roll crushing or pre-crushing of a portion of mill ore.
-
Locked cycle flotation optimization with new reagent suites to increase mill copper and gold recovery to copper concentrate.
-
Substitution of secondary crushing with high-pressure grinding rolls for the SAG/pebble crusher circuit may provide significant electrical operating cost savings.
NATIONAL INSTRUMENT 43-101 COMPLIANCE
The following Qualified Persons under National Instrument 43-101 ("NI 43-101") have reviewed and approved of the scientific, technical and economic information contained in this news release: Daniel Roth, PE, P.Eng. and Benjamin Bermudez, PE of M3 Engineering & Technology Corp., Art S. Ibrado, PE of Fort Lowell Consulting, Michael G. Hester, FAusIMM of Independent Mining Consultants, Inc., Donald Earnest, P.Geo., SME-RM of Resource Evaluation Inc., and John G. Aronson, SME, CEP of ESG Resiliency Plus, LLC.
CAUTIONARY NOTE REGARDING FORWARD-LOOKING STATEMENTS
This announcement includes certain "forward-looking statements" within the meaning of Canadian securities legislation. All statements, other than statements of historical fact included herein are forward-looking statements. Forward-looking statements involve various risks and uncertainties and are based on certain factors and assumptions. There can be no assurance that such statements will prove to be accurate, and actual results and future events could differ materially from those anticipated in such statements. Important factors that could cause actual results to differ materially from the Company's expectations include uncertainties related to fluctuations in gold, copper and other commodity prices and currency exchange rates; uncertainties relating to interpretation of drill results and the geology, continuity and grade of mineral deposits; uncertainties relating to the completion of a bankable feasibility study; uncertainty of estimates of capital and operating costs, recovery rates production estimates and estimated economic return; the need for cooperation of the Company's joint venture partner and government agencies in the development of the Company's mineral projects; the need to obtain additional financing to develop the Company's mineral projects; the possibility of delay in development programs or in construction projects and uncertainty of meeting anticipated program milestones for the Company's mineral projects; and other risks and uncertainties disclosed under the heading "Risk Factors" in the Annual Information Form dated March 22, 2013, and filed with Canadian securities regulatory authorities on the SEDAR+ website at www.sedarplus.ca.
For Further Investor Information Please Contact:
Nicolaos Paraskevas
Email: This email address is being protected from spambots. You need JavaScript enabled to view it.
St. Augustine Gold and Copper Ltd.
1 The benefit cost ratio (BCR) is calculated by dividing the after-tax net present value (at 7% discount) of $4.18 billion by the initial capital cost plus sustaining capital cost (at 7% discount) of $2.28 billion.
2 The LOM waste to ore ratio is from the IMC mine schedule file dated December 23, 2023.
3 The equivalent copper grade is the weighted average over the first five years of mill operations, accounting for copper in concentrate, tailings leach cathode, and copper equivalent from gold in concentrate and bullion. It is calculated by dividing the total equivalent copper (in tonnes) by the total ore treated.
4 The figure represents the average equivalent payable copper produced over Years 3 to 8, including Heap Leach cathode from Year 3, divided by 5. Excluding the Year 3 Heap Leach cathode results in a weighted average of 427,835 klb/year.
5 These costs include the following: concentrate shipping, smelting and refining; cathode shipping; gold shipping and refining, mine site operating costs.
6 The mill equivalent copper grade is calculated by converting the payable gold revenue from the milling ore to equivalent copper by dividing the payable gold revenue by the price of copper in the model ($4.30 per pound copper). The equivalent copper from the gold revenue is added to the payable copper in concentrate and the payable copper from the tailing leach to provide the payable equivalent copper. The payable equivalent copper is converted to the onsite produced equivalent copper by dividing it by the off-site payable percentage. The onsite produced equivalent copper is converted to the equivalent copper contained in the milling ore by dividing it by the milling copper recovery. The contained equivalent copper is divided by the milling ore tonnes to produce the equivalent copper milling grade.