TORONTO / Aug 11, 2025 / Business Wire / Americas Gold and Silver Corporation (TSX: USA) (NYSE American: USAS) (“Americas” or the “Company”), a growing North American precious metals producer, reports consolidated financial and operational results for the quarter ended June 30, 2025.
This press release features multimedia. View the full release here: /news/home/20250811299347/en
This earnings release should be read in conjunction with the Company’s Management’s Discussion and Analysis, Financial Statements and Notes to Financial Statements for the corresponding period, which have been posted on the Americas Gold and Silver Corporation SEDAR+ profile at www.sedarplus.ca, and on its EDGAR profile at www.sec.gov, and which are also available on the Company’s website at www.americas-gold.com. All figures are in U.S. dollars unless otherwise noted.
Highlights
- Consolidated silver production increased 36% year-over-year and 54% quarter-over-quarter as the impact of operational improvements and efficiencies continues at the Galena Complex in Idaho while the positive development progress at the EC120 Project (“EC120”) facilitated the batching of higher grade development ore through the mill.
- Consolidated silver production of 689,000 ounces was achieved during the quarter, or approximately 839,000 silver equivalent2 ounces, including 1.5 million pounds of zinc and 1.9 million pounds of lead.
- Increase in silver sales revenue due to higher realized prices. Consolidated revenue, including by product revenue, decreased to $27.0 million for Q2-2025 or 19% compared to $33.2 million for Q2-2024. The positive impact of higher silver production and realized silver price1 of $34.22/oz was offset by lower production and realized prices of zinc and & lead, as the Company continues development transitioning into the silver-copper EC120 Project which is predominantly higher grade silver and copper compared to San Rafael (higher zinc and lead) mined previously.
- Pre-production sales of EC120 silver-copper concentrate contributed $8.3 million to revenue during Q2-2025.
- Executed Senior secured term loan facility for funds of up to $100 million entered into with SAF Group (“SAF”) primarily to fund growth and development capital spending at the Galena Complex, with the first $50 million tranche of funds received in June.
- Successful metallurgical testwork results at the Galena Complex demonstrated over 90% antimony recovery. The Company commissioned SGS Canada Inc. to conduct flotation tests on the current mill feed. The test results on the tetrahedrite material indicated that a marketable concentrate may now be possible using modern metallurgical processes.
- The test results mark a key step toward establishing the Company as the only current antimony producer in the United States, potentially unlocking a new revenue stream from a strategic by-product, previously counted as a penalty element, of the Galena ore body.
- Multi-Metal Offtake Agreement for Galena Concentrates with Ocean Partners for treatment of up to 100% of the polymetallic concentrates from the Company’s Galena Complex at Teck Resources Limited’s (“Teck”) Trail Operations in Trail British Columbia. Guaranteeing processing capacity at a nearby smelter is critical as the Company executes its plans to significantly increase silver and by-product metal production over the next several years.
- Strong exploration results from the Galena Complex, highlighted by an intersection of 983 g/t over 3.4 metres in the new 034 vein, with an initial vein target of 1.2M-1.5M silver ounces. The Company is continuing its near mine exploration program to target new high-grade mining areas that provide near term mining potential.
- Cash and cash equivalents balance of $61.7 million and working capital1 of $10.4 million as at June 30, 2025 (working capital deficit of $28.7 million as at December 31, 2024).
- Cost of sales1,2 per silver equivalent ounce produced, cash costs1 and all-in sustaining costs1 per silver ounce produced averaged $27.99, $26.64 and $32.89, respectively, in Q2-2025.
- Net loss of $15.1 million for Q2-2025 during the revitalization of Galena (Q2-2024 net loss of $4.0 million), primarily due to the impact of increasing precious metal prices on metals-based liabilities, non-recurring non-cash corporate general and administrative expenses connected with the addition of key technical personnel and reconstitution of the Board, and lower net revenue from decreased base metals production of zinc and lead, as the Cosalá Operations transition to the silver-copper focused EC120 deposit. This was partially offset by lower interest and financing expense, and higher foreign exchange gain as well as very strong silver revenue performance as the company executes its strategy at Galena and Cosala.
- Adjusted earnings1 for Q2-2025 was a loss of $12.1 million (adjusted loss of $2.4 million for Q2-2024) and Adjusted EBITDA1 for Q2-2025 was a loss of $4.1 million (adjusted EBITDA income of $8.0 million for Q2-2024), or $0.02 and $0.01 per share, respectively, primarily due to non-recurring non-cash corporate general and administrative expenses, and lower net revenue from decreased base metals production of zinc and lead.
- Inclusion in the Solactive Global Silver Miners Index announced on May 1, 2025. Inclusion in this major silver index is an important milestone validating Americas position as a growing silver focused miner and increases exposure to large institutional investors.
Paul Andre Huet, Chairman and CEO, commented: “During the first half of 2025, we’ve made significant progress and investments into our strategy to deliver materially increased silver production and lower costs over the coming years. Our teams have been strengthened and aligned in executing our operational growth plan at Galena and the transition from the San Rafael Mine to the higher grade silver-copper EC120 Project at Cosalá. Our critical work in reviewing the current operations has progressed well, including studying multiple scenarios for operational adjustments, productivity improvements, cost reductions and material movement increases.
Securing the US$100 million debt facility in June represents a major milestone for the Company, providing us with the financial flexibility to implement and execute our growth strategy. The result is that we expect to realize incremental production increases and lower costs as we progress through a transformative investment year in 2025 setting us up with a much stronger operational platform to support continued sustained production growth at Galena.
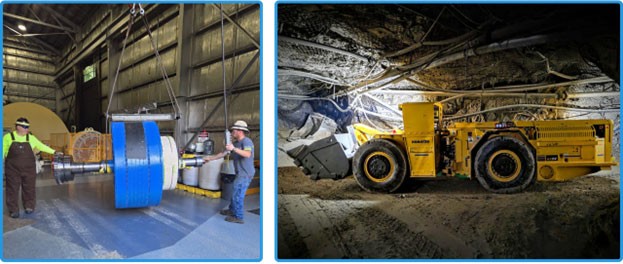
At Galena, numerous initiatives are underway that are designed to safely improve mining productivity. Key developments during the quarter include the expansion of the 55-179 decline to access multiple stopes, the successful development and mining of the first long-hole stope as well as the commissioning of new underground loaders and trucks to enhance productivity. Significant ventilation improvements were achieved with the completion of the first Alimak vent raise, while the development of a second Alimak raise is underway. Very significantly, components for the #3 shaft replacement hoist motor have arrived at site, with installation planned for Q4-2025 to materially boost hoisting capacity and debottleneck operations – a critical step in unlocking value at the mine.
We’re also very excited about the metallurgical testing completed on Galena concentrate that confirmed high recoveries of both antimony and copper, with modern processes enabling the potential extraction of antimony from the tetrahedrite. The test work is a key step in establishing Americas as the only current antimony producer in the U.S., unlocking a potential new revenue stream. Further testing is aimed at confirming the ability to produce saleable antimony products, leveraging historical precedents and enhancing Galena's economic potential. Rounding out the metallurgical successes, we also secured a multi-metal offtake agreement with Ocean Partners at Teck’s Trail Operations in British Columbia. This guaranteed capacity not only secures the growth plan at Galena, it also turns several metals previously penalized (including copper and antimony) into potential revenue streams – a double benefit for our shareholders.
The Cosalá Operations are advancing well towards mining the higher-grade silver-copper EC120 orebody, where we are aiming to be in commercial production by the end of 2025. The team is mining concurrently at San Rafael during the development of EC120, with a focus on mining higher-grade silver areas in late Q3 and early Q4 2025. During the quarter we saw an early example of the positive impact EC120 will have on silver grades and we are looking forward to continuing this progress. In support of the ramp up efforts, we have also placed additional mobile fleet orders to improve operational efficiency as we enter the heart of the orebody in the years ahead – an exciting time for everyone at Americas.
I am also pleased to welcome Shirley In't Veld to Americas Board of Directors. The addition of Shirley's extensive experience as a senior executive and director in the mining, renewables and energy sectors to our team further strengthens our Board and is a strong endorsement of Americas position as growing silver producer. We look forward to benefiting from Shirley’s insights and guidance as we continue to grow and create value for our shareholders.
Overall, I am very pleased with our progress as we leverage the strength of our expanded and strengthened team as well as our bolstered balance sheet to build a strong foundation for our strategy to deliver sustained multi-year production growth, unlocking the massive potential across our asset base for all our stakeholders.”
Consolidated Production
Consolidated silver production of 689,000 ounces during Q2-2025 was higher than Q2-2024 production of 506,000 ounces (36% increase in silver production) due to higher grades at both operations, offset by slightly lower tonnage. At Cosalá, pre-production of EC120 silver-copper concentrate contributed to 211,000 ounces of silver production during Q2-2025. Production of both zinc and lead during the quarter were lower than in Q2-2024 due to lower tonnage of San Rafael ore processed as the Company develops and transitions into the silver-copper EC120 orebody.
Consolidated attributable cash costs and all-in sustaining costs for Q2-2025 were $26.64 per silver ounce and $32.89 per silver ounce, respectively. Cash costs per silver ounce increased during the quarter compared to the same period the year prior, primarily due to lower by-product credits as the Company focused on setting up for future growth.
Galena Complex
The Galena Complex produced 420,000 ounces of silver in Q2-2025 compared to 560,000 ounces of silver in Q2-2024 (25% decrease in silver production). The mine also produced 1.7 million pounds of lead in Q2-2025, compared to 3.0 million pounds of lead in Q2-2024 (44% decrease in lead production). During the period of operational improvements currently underway as part of the transition plan at the Galena Complex, as previously discussed, the Company anticipates potential short-term movements in by-product production levels while the focus on increasing mining rates of silver-copper ore and setting up key infrastructure in support of future growth is advanced. Cash costs per ounce of silver increased to $24.18 in Q2-2025 from $14.78 in Q2-2024, primarily due to modest increases in salaries and employee benefits at the operations inline with the Company’s strategy to attract and retain key technical personnel, and impact from decreased lead production resulting in lower by-product credits during the period.
During Q2-2025, the Company has continued to make significant advances at the Galena Complex and is on-track with its operational growth plan. Development plans are advancing well with efficiencies in muck handling and improved development rates being realized.
Cosalá Operations
Silver production increased in Q2-2025 to ~269,000 ounces of silver compared to ~170,000 ounces of silver in Q2-2024 (58% increase in silver production) primarily due to higher grades and silver recoveries offset by lower tonnages during the period. Higher portion of the mill feed came from pre-production of the EC120 Project which has higher silver grades and silver recoveries based on its minerology. Lower milled tonnage from the San Rafael Main Central orebody caused base metals production to decrease to 1.5 million pounds of zinc and 0.2 million pounds of lead in Q2-2025, compared to 8.9 million pounds of zinc, and 2.6 million pounds of lead in Q2-2024. Silver production is expected to increase steadily as the development into EC120 Project progresses and EC120 continues to batch higher development grade ore through the mill. The Cosalá Operations increased capital spending on the EC120 Project, expending $2.9 million during Q2-2025 ($1.0 million during Q1-2025). The EC120 Project contributed 211,000 ounces of silver production in Q2-2025 (375,000 ounces of silver production project-to-date) as the Cosalá Operations milled and sold silver-copper concentrate during the EC120 Project’s development phase, contributed $8.3 million to net revenue during Q2-2025. Cash costs per silver ounce increased during Q2-2025 to $30.48 per ounce from $7.75 per ounce in Q2-2024 due primarily to decreased zinc and lead production resulting in lower by-product credits during the period.
Board of Directors Strengthened with Appointment of Shirley In’t Veld
The Company is pleased to announce the appointment of Shirley In't Veld to its Board of Directors effective immediately.
Ms. In’t Veld brings extensive depth of knowledge and experience to the Americas Board, having served over 30 years in board and senior management positions in the mining, renewables and energy sectors. She is currently a Director of Westgold Resources Limited and Develop Global Limited. Ms. In’t Veld was formerly a Director Karora Resources Inc., NBN Co. Limited (National Broadband Network Co.), Northern Star Resources Limited, Perth Airport, DUET Group, Asciano Limited and Alcoa of Australia Limited. Ms. In’t Veld was also the Managing Director of Verve Energy (2007 – 2012) and, previously, served 10 years in senior roles at Alcoa of Australia Limited, WMC Resources Ltd, Bond Corporation and BankWest Perth.
Share Consolidation
Americas is also pleased to announce, as previously authorized by its shareholders on June 24 and subsequently approved by its Board of Directors (the “Board”) on August 6, 2025, the Company intends to file articles of amendment on or about August 21, 2025, implementing a consolidation of its outstanding common shares on the basis as finally determined by the Board of one (1) post-consolidation common share for every two point five (2.5) pre-consolidation common shares (the "Consolidation"). The Consolidation has been conditionally approved by the TSX and is subject to NYSE American approval. Americas will issue a further news release providing the date, expected in the next 10 days, on which the Company’s common shares will commence trading on a post-consolidation basis on each of the TSX and NYSE American. The exercise price or conversion price, as applicable, and the number of common shares issuable, as applicable, under any of the Company's outstanding convertible or share-based securities such as warrants, stock options and restricted share units, performance share units and deferred share units, as applicable, will be proportionately adjusted upon completion of the Consolidation in accordance with their respective terms. The CUSIP and ISIN numbers of the post-consolidation common shares will also change upon the completion of the Consolidation.
Conference Call Details
Date: August 11, 2025
Time: 10:00 am ET / 7:00 am PT
The call may be accessed using the following webcast link:
https://zoom.us/webinar/register/WN_6Ro3OqEgSGKDM-LkGaKcXA
Dial-In Toll Free Canada: (833) 955-1088
Dial-In Toll Free USA: (833) 548-0276
Dial-In International Toll Number: +1 (647) 374-4685
Meeting ID: 985 1535 4261
No participant ID – Please press # to join.
A recording of the conference call will be available for replay on the ‘Events’ page of our website later in the day on August 11, 2025.
About Americas Gold and Silver Corporation
Americas Gold & Silver is a growing precious metals mining company with multiple assets in North America. In December 2024, Americas increased its ownership in the Galena Complex (Idaho, USA) from 60% to 100% in a transaction with Eric Sprott, solidifying its position as a silver-focused producer. Americas also owns and operates the Cosalá Operations in Sinaloa, Mexico. Eric Sprott is the Company’s largest shareholder, holding an approximate 20% interest. Americas has a proven and experienced management team led by Paul Huet, is fully funded to execute its growth plans, and focused on becoming one of the top North American silver plays, with an objective of over 80% of its revenue to be generated from silver by the end of 2025.
Technical Information and Qualified Persons
The scientific and technical information relating to the Company’s material mining properties contained herein has been reviewed and approved by Rick Streiff, Executive Vice President – Geology of the Company. Mr. Streiff is a “qualified person” for the purposes of NI 43-101. The Company’s current Annual Information Form and the NI 43-101 Technical Reports for its mineral properties, all of which are available on SEDAR+ at www.sedarplus.ca, and EDGAR at www.sec.gov, contain further details regarding mineral reserve and mineral resource estimates, classification and reporting parameters, key assumptions and associated risks for each of the Company’s material mineral properties, including a breakdown by category.
All mining terms used herein have the meanings set forth in National Instrument 43-101 – Standards of Disclosure for Mineral Projects (“NI 43-101”), as required by Canadian securities regulatory authorities. These standards differ from the requirements of the SEC that are applicable to domestic United States reporting companies. Any mineral reserves and mineral resources reported by the Company in accordance with NI 43-101 may not qualify as such under-SEC standards. Accordingly, information contained in this news release may not be comparable to similar information made public by companies subject to the SEC’s reporting and disclosure requirements.
Cautionary Statement on Forward-Looking Information:
This news release contains “forward-looking information” within the meaning of applicable securities laws. Forward-looking information includes, but is not limited to, Americas’ expectations, intentions, plans, assumptions and beliefs with respect to, among other things, estimated and targeted production rates and results for silver, gold and other metals, the expected prices of silver, gold and other metals, as well as the related costs, expenses and capital expenditures; production from the Galena Complex and Cosalá Operations; expectations regarding the Company’s execution of its plans to significantly increase silver and by-product metal production and improve operational efficiency over the next several years; the Company’s execution of and expected benefits from its growth strategy and plans; the expected timing and completion of required development and the expected operational and production results therefrom, including the anticipated improvements to production and lowering of costs; statements relating to Americas’ EC120 Project; statements relating to the implementation of the Consolidation, including the expected timing thereof and receipt of necessary approvals; and statements relating to results from recent metallurgical testing at its Galena Complex, including the potential recovery of antimony and concentrate levels thereof, and the potential new revenue stream from antimony and copper Guidance and outlook references contained in this press release were prepared based on current mine plan assumptions with respect to production, development, costs and capital expenditures, the metal price assumptions disclosed herein, and assumes no further adverse impacts to the Cosalá Operations from blockades or work stoppages, and completion of the shaft repair and shaft rehab work at the Galena Complex on its expected schedule and budget, the realization of the anticipated benefits therefrom, and is subject to the risks and uncertainties outlined below. The ability to maintain cash flow positive production at the Cosalá Operations, which includes the EC120 Project, through meeting production targets and at the Galena Complex through implementing the Galena Recapitalization Plan, including the completion of the Galena shaft repair and shaft rehab work on its expected schedule and budget, allowing the Company to generate sufficient operating cash flows while facing market fluctuations in commodity prices and inflationary pressures, are significant judgments in the consolidated financial statements with respect to the Company’s liquidity. Should the Company experience negative operating cash flows in future periods, the Company may need to raise additional funds through the issuance of equity or debt securities. Often, but not always, forward-looking information can be identified by forward-looking words such as “anticipate”, “believe”, “expect”, “goal”, “plan”, “intend”, “potential’, “estimate”, “may”, “assume” and “will” or similar words suggesting future outcomes, or other expectations, beliefs, plans, objectives, assumptions, intentions, or statements about future events or performance. Forward-looking information is based on the opinions and estimates of Americas as of the date such information is provided and is subject to known and unknown risks, uncertainties, and other factors that may cause the actual results, level of activity, performance, or achievements of Americas to be materially different from those expressed or implied by such forward-looking information. With respect to the business of Americas, these risks and uncertainties include risks relating to widespread epidemics or pandemic outbreak, actions that have been and may be taken by governmental authorities to contain such epidemic or pandemic or to treat its impact and/or the availability, effectiveness and use of treatments and vaccines (including the effectiveness of boosters); interpretations or reinterpretations of geologic information; unfavorable exploration results; inability to obtain permits required for future exploration, development or production; general economic conditions and conditions affecting the industries in which the Company operates; the uncertainty of regulatory requirements and approvals; potential litigation; fluctuating mineral and commodity prices; the ability to obtain necessary future financing on acceptable terms or at all; the ability to operate the Company’s projects; and risks associated with the mining industry such as economic factors (including future commodity prices, currency fluctuations and energy prices), ground conditions, illegal blockades and other factors limiting mine access or regular operations without interruption, failure of plant, equipment, processes and transportation services to operate as anticipated, environmental risks, government regulation, actual results of current exploration and production activities, possible variations in ore grade or recovery rates, permitting timelines, capital and construction expenditures, reclamation activities, labor relations or disruptions, social and political developments, risks associated with generally elevated inflation and inflationary pressures, risks related to changing global economic conditions, and market volatility, risks relating to geopolitical instability, political unrest, war, and other global conflicts may result in adverse effects on macroeconomic conditions including volatility in financial markets, adverse changes in trade policies, inflation, supply chain disruptions and other risks of the mining industry. Although the Company has attempted to identify important factors that could cause actual results to differ materially from those contained in forward-looking information, there may be other factors that cause results not to be as anticipated, estimated, or intended. Readers are cautioned not to place undue reliance on such information. Additional information regarding the factors that may cause actual results to differ materially from this forward‐looking information is available in Americas’ filings with the Canadian Securities Administrators on SEDAR+ and with the SEC. Americas does not undertake any obligation to update publicly or otherwise revise any forward-looking information whether as a result of new information, future events or other such factors which affect this information, except as required by law. Americas does not give any assurance (1) that Americas will achieve its expectations, or (2) concerning the result or timing thereof. All subsequent written and oral forward‐looking information concerning Americas are expressly qualified in their entirety by the cautionary statements above.
- This is a supplementary or non-GAAP financial measure or ratio. See “Non-GAAP and Other Financial Measures” section below for further information.
- Throughout this news release, contract services related to transportation cost were reclassified from treatment and selling costs in revenue to cost of sales in fiscal 2024.
Non-GAAP and Other Financial Measures
The Company has included certain non-GAAP financial and other measures to supplement the Company’s consolidated financial statements, which are presented in accordance with IFRS, including the following:
- Average realized silver, zinc and lead prices;
- Cost of sales (CoS)/Ag Eq oz produced;
- Cash costs/Ag oz produced;
- All-in sustaining costs/Ag oz produced;
- Net cash generated from operating activities;
- Working capital;
- EBITDA, adjusted EBITDA, and adjusted earnings; and
- Silver equivalent production (Ag Eq).
Management uses these measures, together with measures determined in accordance with IFRS, internally to better assess performance trends and understands that a number of investors, and others who follow the Company’s performance, also assess performance in this manner. These non-GAAP and other financial measures should not be considered in isolation or as a substitute for measures of performance prepared in accordance with IFRS. Non-GAAP and other financial measures do not have any standardized meaning prescribed under IFRS, and therefore they may differ from methods used by other companies with similar descriptions. Management's determination of the components of non-GAAP financial measures and other financial measures are evaluated on a periodic basis influenced by new items and transactions, a review of investor uses and new regulations as applicable. Any changes to the measures are duly noted and retrospectively applied as applicable. Subtotals and per unit measures may not calculate based on amounts presented in the following tables due to rounding.
Average Realized Silver, Zinc and Lead Prices
The Company uses the financial measures "average realized silver price", "average realized zinc price” and “average realized lead price” because it understands that in addition to conventional measures prepared in accordance with IFRS, certain investors and analysts use this information to evaluate the Company’s performance vis-à-vis average market prices of metals for the period. The presentation of average realized metal prices is not meant to be a substitute for the revenue information presented in accordance with IFRS, but rather should be evaluated in conjunction with such IFRS measure.
Average realized metal prices represent the sale price of the underlying metal excluding unrealized mark-to-market gains and losses on provisional pricing and concentrate treatment and refining charges. Average realized silver, zinc and lead prices are calculated as the revenue related to each of the metals sold, e.g. revenue from sales of silver divided by the quantity of ounces sold.
|
Reconciliation of Average Realized Silver, Zinc and Lead Prices1 |
||||||||
|
|
Q2-2025 |
Q2-2024 |
YTD-2025 |
YTD-2024 |
||||
|
Gross silver sales revenue ('000) |
$ |
16,115 |
$ |
21,793 |
$ |
28,738 |
$ |
35,381 |
|
Payable metals & fixed pricing adjustments ('000) |
|
27 |
|
14 |
|
(26) |
|
27 |
|
Payable silver sales revenue ('000) |
$ |
16,142 |
$ |
21,807 |
$ |
28,712 |
$ |
35,408 |
|
Divided by silver sold (oz) |
|
471,664 |
|
745,921 |
|
863,301 |
|
1,331,972 |
|
Average realized silver price ($/oz) |
$ |
34.22 |
$ |
29.23 |
$ |
33.26 |
$ |
26.58 |
|
|
|
|
|
|
||||
|
|
Q2-2025 |
Q2-2024 |
YTD-2025 |
YTD-2024 |
||||
|
Gross zinc sales revenue ('000) |
$ |
2,274 |
$ |
11,261 |
$ |
11,775 |
$ |
19,922 |
|
Payable metals & fixed pricing adjustments ('000) |
|
(3) |
|
31 |
|
(26) |
|
31 |
|
Payable zinc sales revenue ('000) |
$ |
2,271 |
$ |
11,292 |
$ |
11,749 |
$ |
19,953 |
|
Divided by zinc sold (lb) |
|
1,917,354 |
|
8,677,305 |
|
9,388,118 |
|
16,453,877 |
|
Average realized zinc price ($/lb) |
$ |
1.18 |
$ |
1.30 |
$ |
1.25 |
$ |
1.21 |
|
|
||||||||
|
|
Q2-2025 |
Q2-2024 |
YTD-2025 |
YTD-2024 |
||||
|
Gross lead sales revenue ('000) |
$ |
1,852 |
$ |
5,652 |
$ |
5,264 |
$ |
9,792 |
|
Payable metals & fixed pricing adjustments ('000) |
|
(1) |
|
(15) |
|
(1) |
|
(11) |
|
Payable lead sales revenue ('000) |
$ |
1,851 |
$ |
5,637 |
$ |
5,263 |
$ |
9,781 |
|
Divided by lead sold (lb) |
|
2,076,077 |
|
5,718,958 |
|
5,864,460 |
|
10,148,810 |
|
Average realized lead price ($/lb) |
$ |
0.89 |
$ |
0.99 |
$ |
0.90 |
$ |
0.96 |
|
1 |
Excludes EC120 Project pre-production silver ounces sold from the Cosalá Operations. |
Cost of Sales/Ag Eq Oz Produced
The Company uses the financial measure “Cost of Sales/Ag Eq Oz Produced” because it understands that, in addition to conventional measures prepared in accordance with IFRS, certain investors and analysts use this information to evaluate the Company’s underlying cost of operations. Silver equivalent production are based on all metals production at average realized silver, zinc, and lead prices during each respective period, except as otherwise noted.
|
Reconciliation of Consolidated Cost of Sales/Ag Eq Oz Produced |
||||||||
|
|
Q2-20251 |
Q2-20241,2 |
YTD-20251 |
YTD-20241,2 |
||||
|
Cost of sales ('000) |
$ |
23,479 |
$ |
21,562 |
$ |
44,618 |
$ |
42,600 |
|
Less non-controlling interests portion ('000) |
|
- |
|
(4,160) |
|
- |
|
(7,648) |
|
Attributable cost of sales ('000) |
|
23,479 |
|
17,402 |
|
44,618 |
|
34,952 |
|
Divided by silver equivalent produced (oz) |
|
838,738 |
|
1,058,186 |
|
1,676,538 |
|
2,079,050 |
|
Cost of sales/Ag Eq oz produced ($/oz) |
$ |
27.99 |
$ |
16.45 |
$ |
26.61 |
$ |
16.81 |
|
Reconciliation of Cosalá Operations Cost of Sales/Ag Eq Oz Produced |
||||||||
|
|
Q2-20251 |
Q2-20241,2 |
YTD-20251 |
YTD-20241,2 |
||||
|
Cost of sales ('000) |
$ |
11,600 |
$ |
11,163 |
$ |
22,591 |
$ |
23,479 |
|
Divided by silver equivalent produced (oz) |
|
373,726 |
|
659,603 |
|
834,234 |
|
1,447,810 |
|
Cost of sales/Ag Eq oz produced ($/oz) |
$ |
31.04 |
$ |
16.92 |
$ |
27.08 |
$ |
16.22 |
|
Reconciliation of Galena Complex Cost of Sales/Ag Eq Oz Produced |
||||||||
|
|
Q2-2025 |
Q2-20242 |
YTD-2025 |
YTD-20242 |
||||
|
Cost of sales ('000) |
$ |
11,879 |
$ |
10,399 |
$ |
22,027 |
$ |
19,121 |
|
Divided by silver equivalent produced (oz) |
|
465,012 |
|
664,305 |
|
842,304 |
|
1,052,066 |
|
Cost of sales/Ag Eq oz produced ($/oz) |
$ |
25.55 |
$ |
15.65 |
$ |
26.15 |
$ |
18.17 |
|
1 |
Throughout this MD&A, tonnes milled, silver grade and recovery, silver production and sales, silver equivalent production, and cost per ounce measurements during fiscal 2025 and 2024 include EC120 Project pre-production from the Cosalá Operations. |
|||||||
|
2 |
Throughout this MD&A, contract services related to transportation costs were reclassified from treatment and selling costs in revenue to cost of sales in fiscal 2024. |
Cash Costs and Cash Costs/Ag Oz Produced
The Company uses the financial measures “Cash Costs” and “Cash Costs/Ag Oz Produced” in accordance with measures widely reported in the silver mining industry as a benchmark for performance measurement and because it understands that, in addition to conventional measures prepared in accordance with IFRS, certain investors and analysts use this information to evaluate the Company’s underlying cash costs of operations.
Cash costs are determined on a mine-by-mine basis and include mine site operating costs such as: mining, processing, administration, production taxes and royalties which are not based on sales or taxable income calculations. Non-cash costs consist of: non-cash related charges to cost of sales including inventory movements, write-downs to net realizable value of concentrates, ore stockpiles, and spare parts and supplies, and employee profit share accruals.
|
Reconciliation of Consolidated Cash Costs/Ag Oz Produced |
||||||||
|
|
Q2-20251 |
Q2-20241 |
YTD-20251 |
YTD-20241 |
||||
|
Cost of sales ('000) |
$ |
23,479 |
$ |
21,562 |
$ |
44,618 |
$ |
42,600 |
|
Less non-controlling interests portion ('000) |
|
- |
|
(4,160) |
|
- |
|
(7,648) |
|
Attributable cost of sales ('000) |
|
23,479 |
|
17,402 |
|
44,618 |
|
34,952 |
|
Smelting, refining & royalty expenses in CoS ('000) |
|
(504) |
|
(1,467) |
|
(1,572) |
|
(2,768) |
|
Non-cash costs ('000) |
|
(1,003) |
|
(487) |
|
(2,397) |
|
(335) |
|
Direct mining costs ('000) |
$ |
21,972 |
$ |
15,448 |
$ |
40,649 |
$ |
31,849 |
|
Smelting, refining & royalty expenses ('000) |
|
1,160 |
|
4,416 |
|
4,394 |
|
8,759 |
|
Less by-product credits ('000) |
|
(4,787) |
|
(13,578) |
|
(15,524) |
|
(24,368) |
|
Cash costs ('000) |
$ |
18,345 |
$ |
6,286 |
$ |
29,519 |
$ |
16,240 |
|
Divided by silver produced (oz) |
|
688,663 |
|
505,932 |
|
1,134,870 |
|
989,852 |
|
Cash costs/Ag oz produced ($/oz) |
$ |
26.64 |
$ |
12.42 |
$ |
26.01 |
$ |
16.41 |
|
Reconciliation of Cosalá Operations Cash Costs/Ag Oz Produced |
||||||||
|
|
Q2-20251 |
Q2-20241 |
YTD-20251 |
YTD-20241 |
||||
|
Cost of sales ('000) |
$ |
11,600 |
$ |
11,163 |
$ |
22,591 |
$ |
23,479 |
|
Smelting, refining & royalty expenses in CoS ('000) |
|
(314) |
|
(1,288) |
|
(1,169) |
|
(2,495) |
|
Non-cash costs ('000) |
|
(611) |
|
(227) |
|
(1,922) |
|
(505) |
|
Direct mining costs ('000) |
$ |
10,675 |
$ |
9,648 |
$ |
19,500 |
$ |
20,479 |
|
Smelting, refining & royalty expenses ('000) |
|
914 |
|
3,573 |
|
3,374 |
|
7,422 |
|
Less by-product credits ('000) |
|
(3,400) |
|
(11,905) |
|
(12,320) |
|
(21,698) |
|
Cash costs ('000) |
$ |
8,189 |
$ |
1,316 |
$ |
10,554 |
$ |
6,203 |
|
Divided by silver produced (oz) |
|
268,702 |
|
169,728 |
|
401,146 |
|
466,990 |
|
Cash costs/Ag oz produced ($/oz) |
$ |
30.48 |
$ |
7.75 |
$ |
26.31 |
$ |
13.28 |
|
Reconciliation of Galena Complex Cash Costs/Ag Oz Produced |
||||||||
|
|
Q2-2025 |
Q2-2024 |
YTD-2025 |
YTD-2024 |
||||
|
Cost of sales ('000) |
$ |
11,879 |
$ |
10,399 |
$ |
22,027 |
$ |
19,121 |
|
Smelting, refining & royalty expenses in CoS ('000) |
|
(190) |
|
(299) |
|
(403) |
|
(455) |
|
Non-cash costs ('000) |
|
(392) |
|
(432) |
|
(475) |
|
284 |
|
Direct mining costs ('000) |
$ |
11,297 |
$ |
9,668 |
$ |
21,149 |
$ |
18,950 |
|
Smelting, refining & royalty expenses ('000) |
|
246 |
|
1,405 |
|
1,020 |
|
2,228 |
|
Less by-product credits ('000) |
|
(1,387) |
|
(2,789) |
|
(3,204) |
|
(4,450) |
|
Cash costs ('000) |
$ |
10,156 |
$ |
8,284 |
$ |
18,965 |
$ |
16,728 |
|
Divided by silver produced (oz) |
|
419,961 |
|
560,340 |
|
733,724 |
|
871,436 |
|
Cash costs/Ag oz produced ($/oz) |
$ |
24.18 |
$ |
14.78 |
$ |
25.85 |
$ |
19.20 |
|
1 |
Throughout this MD&A, tonnes milled, silver grade and recovery, silver production and sales, silver equivalent production, and cost per ounce measurements during fiscal 2025 and 2024 include EC120 Project pre-production from the Cosalá Operations. |
All-In Sustaining Costs and All-In Sustaining Costs/Ag Oz Produced
The Company uses the financial measures “All-In Sustaining Costs” and “All-In Sustaining Costs/Ag Oz Produced” in accordance with measures widely reported in the silver mining industry as a benchmark for performance measurement and because it understands that, in addition to conventional measures prepared in accordance with IFRS, certain investors and analysts use this information to evaluate the Company’s total costs of producing silver from operations.
All-in sustaining costs is cash costs plus all sustaining development, capital expenditures, and exploration spending, excluding costs not related to current operations.
|
Reconciliation of Consolidated All-In Sustaining Costs/Ag Oz Produced |
||||||||
|
|
Q2-20251 |
Q2-20241 |
YTD-20251 |
YTD-20241 |
||||
|
Cash costs ('000) |
$ |
18,345 |
$ |
6,286 |
$ |
29,519 |
$ |
16,240 |
|
Capital expenditures ('000)2 |
|
3,409 |
|
2,994 |
|
6,902 |
|
6,932 |
|
Exploration costs ('000) |
|
894 |
|
626 |
|
2,143 |
|
1,272 |
|
All-in sustaining costs ('000) |
$ |
22,648 |
$ |
9,906 |
$ |
38,564 |
$ |
24,444 |
|
Divided by silver produced (oz) |
|
688,663 |
|
505,932 |
|
1,134,870 |
|
989,852 |
|
All-in sustaining costs/Ag oz produced ($/oz) |
$ |
32.89 |
$ |
19.58 |
$ |
33.98 |
$ |
24.69 |
|
Reconciliation of Cosalá Operations All-In Sustaining Costs/Ag Oz Produced |
||||||||
|
|
Q2-20251 |
Q2-20241 |
YTD-20251 |
YTD-20241 |
||||
|
Cash costs ('000) |
$ |
8,189 |
$ |
1,316 |
$ |
10,554 |
$ |
6,203 |
|
Capital expenditures ('000)2 |
|
215 |
|
968 |
|
644 |
|
2,849 |
|
Exploration costs ('000) |
|
421 |
|
250 |
|
1,241 |
|
373 |
|
All-in sustaining costs ('000) |
$ |
8,825 |
$ |
2,534 |
$ |
12,439 |
$ |
9,425 |
|
Divided by silver produced (oz) |
|
268,702 |
|
169,728 |
|
401,146 |
|
466,990 |
|
All-in sustaining costs/Ag oz produced ($/oz) |
$ |
32.84 |
$ |
14.93 |
$ |
31.01 |
$ |
20.18 |
|
Reconciliation of Galena Complex All-In Sustaining Costs/Ag Oz Produced |
||||||||
|
|
Q2-2025 |
Q2-2024 |
YTD-2025 |
YTD-2024 |
||||
|
Cash costs ('000) |
$ |
10,156 |
$ |
8,284 |
$ |
18,965 |
$ |
16,728 |
|
Capital expenditures ('000)2 |
|
3,194 |
|
3,377 |
|
6,258 |
|
6,805 |
|
Exploration costs ('000) |
|
473 |
|
627 |
|
902 |
|
1,498 |
|
All-in sustaining costs ('000) |
$ |
13,823 |
$ |
12,288 |
$ |
26,125 |
$ |
25,031 |
|
Divided by silver produced (oz) |
|
419,961 |
|
560,340 |
|
733,724 |
|
871,436 |
|
All-in sustaining costs/Ag oz produced ($/oz) |
$ |
32.91 |
$ |
21.93 |
$ |
35.61 |
$ |
28.72 |
|
|
1 |
Throughout this MD&A, tonnes milled, silver grade and recovery, silver production and sales, silver equivalent production, and cost per ounce measurements during fiscal 2025 and 2024 include EC120 Project pre-production from the Cosalá Operations. |
||||||
|
|
2 |
For fiscal 2025, capital expenditures exclude growth capital from the Galena Complex and Cosalá Operations, including capital spend on the EC120 Project. |
Net Cash Generated from Operating Activities
The Company uses the financial measure “net cash generated from operating activities” because it understands that, in addition to conventional measures prepared in accordance with IFRS, certain investors and analysts use this information to evaluate the Company’s liquidity, operational efficiency, and short-term financial health.
This is a financial measure disclosed in the Company’s statements of cash flows determined as cash generated from operating activities, after changes in non-cash working capital items.
|
Reconciliation of Net Cash Generated from Operating Activities |
||||||||
|
|
Q2-2025 |
Q2-2024 |
YTD-2025 |
YTD-2024 |
||||
|
Cash generated from (used in) operating activities ('000) |
$ |
1,247 |
$ |
7,566 |
$ |
(318) |
$ |
2,550 |
|
Changes in non-cash working capital items ('000) |
|
3,929 |
|
(5,291) |
|
(1,537) |
|
(104) |
|
Net cash generated from (used in) operating activities ('000) |
$ |
5,176 |
$ |
2,275 |
$ |
(1,855) |
$ |
2,446 |
Working Capital
The Company uses the financial measure “working capital” because it understands that, in addition to conventional measures prepared in accordance with IFRS, certain investors and analysts use this information to evaluate the Company’s liquidity, operational efficiency, and short-term financial health.
Working capital is the excess of current assets over current liabilities.
|
Reconciliation of Working Capital |
||||
|
|
Q2-2025 |
Q2-2024 |
||
|
Current Assets ('000) |
$ |
83,832 |
$ |
26,385 |
|
Less current liabilities ('000) |
|
(73,449) |
|
(65,235) |
|
Working capital ('000) |
$ |
10,383 |
$ |
(38,850) |
EBITDA, Adjusted EBITDA, and Adjusted Earnings
The Company uses the financial measures “EBITDA”, “adjusted EBITDA” and “adjusted earnings” as indicators of the Company’s ability to generate operating cash flows to fund working capital needs, service debt obligations, and fund exploration and evaluation, and capital expenditures. These financial measures exclude the impact of certain items and therefore is not necessarily indicative of operating profit or cash flows from operating activities as determined under IFRS. Other companies may calculate these financial measures differently.
EBITDA is net income (loss) under IFRS before depletion and amortization, interest and financing expense, and income taxes. Adjusted EBITDA further excludes other non-cash items such as accretion expenses, impairment charges, and other fair value gains and losses.
|
Reconciliation of EBITDA and Adjusted EBITDA |
||||||||
|
|
Q2-2025 |
Q2-2024 |
YTD-2025 |
YTD-2024 |
||||
|
Net loss ('000) |
$ |
(15,103) |
$ |
(4,003) |
$ |
(34,021) |
$ |
(20,160) |
|
Depletion and amortization ('000) |
|
6,497 |
|
7,180 |
|
12,006 |
|
12,704 |
|
Interest and financing expense ('000) |
|
1,381 |
|
2,922 |
|
1,855 |
|
3,611 |
|
Income tax recovery ('000) |
|
121 |
|
286 |
|
93 |
|
271 |
|
EBITDA ('000) |
$ |
(7,104) |
$ |
6,385 |
$ |
(20,067) |
$ |
(3,574) |
|
Accretion on decommissioning provision ('000) |
|
154 |
|
159 |
|
314 |
|
312 |
|
Foreign exchange loss (gain) ('000) |
|
(2,809) |
|
(124) |
|
(2,984) |
|
1,012 |
|
Gain on disposal of assets ('000) |
|
- |
|
- |
|
(966) |
|
- |
|
Loss on metals contract liabilities ('000) |
|
5,549 |
|
1,668 |
|
14,573 |
|
4,714 |
|
Other loss (gain) on derivatives ('000) |
|
- |
|
(327) |
|
(709) |
|
744 |
|
Fair value loss on royalty payable ('000) |
|
156 |
|
257 |
|
281 |
|
513 |
|
Adjusted EBITDA ('000) |
$ |
(4,054) |
$ |
8,018 |
$ |
(9,558) |
$ |
3,721 |
Adjusted earnings is net income (loss) under IFRS excluding other non-cash items such as accretion expenses, impairment charges, and other fair value gains and losses.
|
Reconciliation of Adjusted Earnings |
||||||||
|
|
Q2-2025 |
Q2-2024 |
YTD-2025 |
YTD-2024 |
||||
|
Net loss ('000) |
$ |
(15,103) |
$ |
(4,003) |
$ |
(34,021) |
$ |
(20,160) |
|
Accretion on decommissioning provision ('000) |
|
154 |
|
159 |
|
314 |
|
312 |
|
Foreign exchange loss (gain) ('000) |
|
(2,809) |
|
(124) |
|
(2,984) |
|
1,012 |
|
Gain on disposal of assets ('000) |
|
- |
|
- |
|
(966) |
|
- |
|
Loss on metals contract liabilities ('000) |
|
5,549 |
|
1,668 |
|
14,573 |
|
4,714 |
|
Other loss (gain) on derivatives ('000) |
|
- |
|
(327) |
|
(709) |
|
744 |
|
Fair value loss on royalty payable ('000) |
|
156 |
|
257 |
|
281 |
|
513 |
|
Adjusted earnings ('000) |
$ |
(12,053) |
$ |
(2,370) |
$ |
(23,512) |
$ |
(12,865) |
Supplementary Financial Measures
The Company references certain supplementary financial measures that are not defined terms under IFRS to assess performance because it believes they provide useful supplemental information to investors.
Silver Equivalent Production
References to silver equivalent production are based on all metals production at average realized silver, zinc, and lead prices during each respective period, except as otherwise noted.