SUBIACO, Western Australia, Nov. 5, 2015 /CNW/ - RTG Mining Inc. ("RTG", "the Company") (TSX Code: RTG, ASX Code: RTG) is pleased to report an update of the Mineral Resource for the Mabilo Project reported in accordance with the JORC Code (2012) and National Instrument 43-101 – Standards of Disclosure for Mineral Projects. The Indicated Mineral Resource category has significantly increased by 52% to 8.9Mt. The new Mineral Resource Statement (with significant potential to grow with further drilling) delivers sufficient resources to justify a Feasibility Study with a 10 year mine life, which is expected to be finalised later in the current quarter.
The Indicated Mineral Resource includes significant high grade oxide gold and copper at shallow levels which contains 67,100 ounces of gold, 32,100t of copper and 320,800t of iron.
There remains significant scope for further expansion of the resource. The magnetite skarn mineralisation, which makes up the significant portion of the Mineral Resource is well defined and remains open, down plunge and along strike.
Highlights of the resource include: –
- Total Indicated Resource of 8.9Mt at 1.92% Cu, 2.03g/t Au, 9.79g/t Ag and 45.56 Fe, containing 169,800t copper and 577,600oz of gold at a 0.3g/t Au cut-off grade (Table1).
- Total Inferred Resource of 3.9Mt at 1.46% Cu, 1.47g/t Au, 9.09g/t Ag and 29.02% Fe, containing 57,000t copper and 184,900oz of gold at a 0.3g/t Au cut-off grade (Table 1).
- Indicated Oxide Resource that includes a high grade oxide gold "cap" zone (385,000t @ 2.9g/t Au) and a very high grade Supergene Chalcocite zone (102,000t @ 23.0% Cu) at shallow levels (Table 2).
- Significant upside potential remains to upgrade the Inferred Resource and to further extend the magnetite skarn mineralisation along strike and down dip beyond the current resource model.
| Mineral Resource Estimate Results - Reporting at 0.3 g/t Au lower cut-off - Mabilo South and North Deposits | ||||||||||
| Classification | Weathering | Million Tonnes | Cu % | Au g/t | Ag g/t | Fe % | Contained Au ('000s Oz) |
Contained Cu ('000s t) | Contained Fe ('000s t) | Cu Equivalent* ('000s t) |
| Indicated | Oxide + Supergene | 0.78 | 4.1 | 2.7 | 9.7 | 41.2 | 67.1 | 32.1 | 320.8 | 45.7 |
| Indicated | Fresh | 8.08 | 1.7 | 2.0 | 9.8 | 46.0 | 510.5 | 137.7 | 3,713.7 | 264.1 |
| Indicated | Total All Materials | 8.86 | 1.9 | 2.0 | 9.8 | 45.6 | 577.6 | 169.8 | 4,034.5 | 309.8 |
| Inferred | Oxide + Supergene | 0.05 | 7.8 | 2.3 | 9.6 | 26.0 | 3.5 | 3.7 | 12.3 | 4.2 |
| Inferred | Fresh | 3.86 | 1.4 | 1.5 | 9.1 | 29.1 | 181.5 | 53.3 | 1,121.8 | 96.3 |
| Inferred | Total All Materials | 3.91 | 1.5 | 1.5 | 9.1 | 29.0 | 184.9 | 57.0 | 1,134.1 | 100.5 |
| Note: The Mineral Resource was estimated within constraining wireframe solids based on the mineralised geological units. The Mineral Resource is quoted from all classified blocks above a lower cut-off grade 0.3 g/t Au within these wireframe solids. Differences may occur due to rounding. | ||||||||||
| * Cu equivalent is calculated using the following formula which incorporates recovery factors from metallurgical test work: Cu Equivalent = ((75.2%*Au Oz)*$1,200)+((92.8%*Cu Tonnes)*$5,200)+((88.4%*Fe Tonnes)*$65)+((60%*Ag Oz)*$16))/$5,200 |
||||||||||
Table 1 - Total Mabilo Resource at 0.3 g/t Au Cut-off Grade
OXIDE STRATEGY
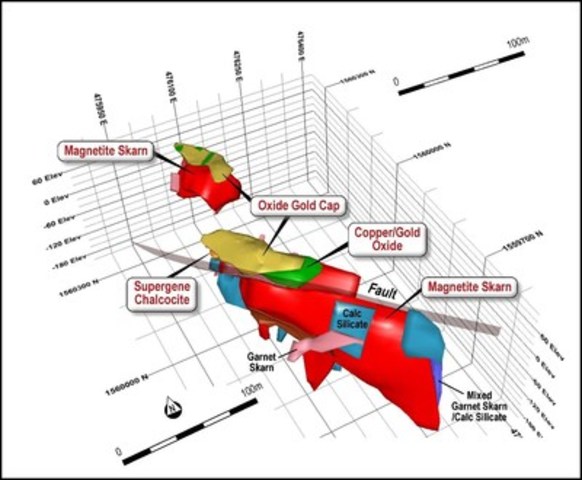
The Indicated Oxide Resource includes a high grade oxide gold "cap" zone (385,000t @ 2.9g/t Au) and a very high grade Supergene Chalcocite zone (102,000t @ 23.2% Cu) at shallow levels (Table 2). Given the high grade nature of this shallow oxide mineralisation, this area will be the focus of the initial development strategy. (See Figure 1).
| Indicated | |||||||
| South Mineralised Zone | Million Tonnes | Au g/t | Cu % | Fe % | Contained Au | Contained Cu ('000s t) | Contained Fe |
| ('000s oz) | ('000s t) | ||||||
| Oxide Gold Cap | 0.33 | 3.1 | 0.2 | 42.6 | 33.3 | 0.7 | 142.2 |
| Oxide Copper/Gold | 0.28 | 2.4 | 2.6 | 44 | 21.6 | 7.1 | 121.4 |
| Supergene Chalcocite | 0.1 | 2.3 | 23.2 | 38.4 | 7.6 | 23.7 | 39.2 |
| Sub-Total | 0.71 | 2.7 | 4.4 | 42.5 | 62.5 | 31.5 | 302.8 |
| North Mineralised Zone | |||||||
| Oxide Gold Cap | 0.05 | 1.9 | 0.2 | 29.7 | 3 | 0.1 | 15.1 |
| Oxide Copper/Gold | 0.02 | 2.8 | 3 | 17.7 | 1.5 | 0.5 | 3 |
| Sub Total | 0.07 | 2.1 | 0.9 | 26.7 | 4.6 | 0.6 | 18 |
| Total | 0.78 | 2.7 | 4.1 | 41.2 | 67.1 | 32.1 | 320.8 |
| Inferred | |||||||
| North Mineralised Zone | Million Tonnes | Au g/t | Cu % | Fe % | Contained Au | Contained Cu ('000s t) | Contained Fe |
| ('000s oz) | ('000s t) | ||||||
| Oxide Gold Cap | 0.02 | 1.7 | 0.2 | 27.6 | 1.2 | 0.1 | 6 |
| Oxide Copper/Gold | 0.01 | 1.9 | 2.3 | 20.8 | 0.8 | 0.3 | 2.6 |
| Supergene Chalcocite | 0.01 | 3.6 | 26 | 28.2 | 1.5 | 3.4 | 3.6 |
| Sub Total | 0.05 | 2.3 | 7.8 | 26 | 3.5 | 3.7 | 12.3 |
| Note: The Mineral Resource was estimated within constraining wireframe solids based on the mineralised geological units. The resource is quoted from all classified blocks above a lower cut-off grade 0.3 g/t Au within these wireframe solids. Differences may occur due to rounding | |||||||
Table 2 - Oxide Gold and Chalcocite Copper Mabilo Resource at 0.3g/t Au Cut-off Grade
PRIMARY STRATEGY
The majority of the Mabilo Project value is contained within the primary resource representing 91% of the 8.86Mt defined Indicated tonnes. Figure 2 highlights the magnetite skarn in the Southern Mineralised Zone. This resource contains significant Indicated tonnes of Copper-Gold-Iron Skarn. Initial resource work focused on clearly defining the Oxide Resource. Drilling since the maiden resource was announced has focused on better defining the copper-gold-magnetite skarn to provide confidence in the Mineral Resource for the Feasibility Study currently being finalised.
The majority of the Mabilo Project primary resource is the magnetite skarn of the North and South Mineralised zones. The magnetite skarn in the North Mineralised Zone is relatively higher in grade at 2.43% Cu and 2.21g/t Au compared to that in the south at 1.67% Cu and 2.01g/t Au. The shallow plunging and down dip extending South Mineralised Zone contains the majority of the tonnes and is a primary focus for the Company. The North Mineralised Zone magnetite skarn resource occurs at shallower levels and will be used to supplement the South Mineralised Zone and contains significant true widths and higher tonnes.
RTG Chief Executive Officer, Justine Magee said that this is the second mineral resource for the Mabilo Project, and underpins the long term potential of the project.
"The second Mineral Resource, delivered in less than 18 months from investing in the project, demonstrates a significant opportunity for the Company, The mineralized zones remain open along strike, down dip and down plunge with significant exploration upside from other untested areas within the tenement." Ms Magee said.
ABOUT MABILO
The Mabilo Project is located in Camarines Norte Province, Eastern Luzon, Philippines (Figure 3). It comprises one granted Exploration Permit (EP-014-2013-V) of approximately 498 ha (currently in renewal process) and two Exploration Permit Applications (EXPA-000188-V) of 2,737 ha and (EXPA 0000 209-V) of 498 ha. The Project area is relatively flat and is easily accessed by 15 km of all-weather road from the highway at the nearby town of Labo.
Summary of Mineral Resource Estimate and Reporting Criteria
The Mineral Resource was prepared by independent resource consultancy CSA Global Pty Ltd ("CSA Global").
Geology and Geological Interpretation
Two mineralised magnetite skarn bodies were initially targeted using ground magnetic data and have been subsequently drilled. The magnetite skarn mineralisation is parallel to the host carbonate unit and passes down-dip into garnet skarn, contact metamorphosed marble or limestone. Magnetite skarn represents the replacement bodies of the limestone marble lithologies. Magnetite skarn bodies have been fault off-set laterally with magnetite continuing across offset zones as strongly mineralised magnetite breccias.
Magnetite near surface has been subject to tropical weathering and the development of an oxide zone dominated by a significant gold-rich, copper-depleted cap (referred to as Oxide Gold "Cap"). A high grade chalcocite zone dominates the northern end of the South Zone with the remainder of the oxide resource being oxidised magnetite skarn with similar copper and gold grades to primary magnetite.
The North Mineralised Zone and South Mineralised Zone have both been modelled for this Mineral Resource Estimate ("MRE"). Mineralised skarn is dipping 60 degrees to the southwest and striking approximately 320 degrees. The North Mineralised Zone is approximately 160m in strike length and is fault offset 150m from the larger South Mineralised Zone which is approximately 500m in strike length. The South Mineralised Zone is fault offset into two fault blocks. The thickness of magnetite skarn is variable due to lithological variation of the host marble limestone. At the southern end of the South Mineralised Zone, magnetite is approximately 30m in thickness, thinning down dip to approximately 15m at the marble contacts (Figure 4). At the northern end of the South Mineralised Zone the thickness is approximately 45-50m where it has been subjected to oxidation and supergene enrichment before being covered by volcanic lahars and tuffs. The North Mineralised Zone is up to 60m thick, and thinning to 15m at the magnetite-marble contact.
The skarn has been subjected to extensive retrograde alteration. This includes variable overprint of the magnetite skarn by pyrite.
Drilling and Sampling Techniques
The MRE is based on data obtained from 98 diamond core drill holes (18,200.90m) drilled across the two mineralised zones. Drill holes are located on a nominal 40m by 40m spacing across primary magnetite zones with good geological continuity. Oxide and chalcocite zones were drilled at 25m by 20m nominal spacing with drilling oriented approximately north-west to south-east across the strike of mineralisation. The dip of the drill holes was designed to intersect the mineralisation at the optimal angle to minimise sampling bias with a number of early vertical holes followed up with angled holes. All drill results included in the MRE have been reported in previous releases.
The majority of the drill hole collars were surveyed using a differential global positioning system ("DGPS") to centimetre accuracy. All down-hole surveying was carried out using a combination of Reflex Ez-Trak multi-shot survey tool at 30m intervals down hole and the Reflex Gyro system was used where magnetite skarn was intersected.
All diamond drill core was geologically logged, recording relevant data to a set template. Diamond core was also geotechnically logged and the core photographed for future record. Diamond core was half core sampled to geology contacts. Core samples were submitted for analysis to ISO-certified Intertek McPhar Laboratory in Manila. Field quality assurance procedures were employed, including the use of standards, blanks and duplicates. The drill hole data is maintained in a secure relational database by company personnel.
Sample Analysis Method
Half core samples were cut and sent for analysis to Intertek McPhar Laboratory, an independent ISO-certified laboratory in Manila. Samples were crushed and pulverised (95% <75 ɥm). Gold was analysed by 50g Fire Assay and the other elements including copper and iron by ICP-MS (Inductively Coupled Plasma Mass Spectrometry) or ICP-OES (Inductively Coupled Plasma Optical Emission Spectrometry) following a four-acid digest.
The sample preparation and assay techniques used for the assay results reported herein are of international industry standard and can be considered total. As a result, Iron grade though dominated by Iron in magnetite, includes Iron in other minerals including chalcopyrite and pyrite.
Resource Estimation Methodology
Datamine Studio 3 software was used for all geological modelling, block modelling, grade interpolation, Mineral Resource classification and reporting. Mineralisation domains were modelled based on the geological interpretation from the lithological logging of drill core and drill sample assay results. For the magnetite skarn zones, which are by definition mineralised with magnetite iron, the lithological logging has driven the interpretation. Other lithological units in the system are not necessarily mineralised to potentially economic levels throughout their full extents. These zones have been modelled using a nominal lower cut-off grade combination of 0.3g/t Au and 0.3% Cu in concert with the lithological logging to generate mineralised lithological domains.
The block model consists of 41 mineralisation lenses grouped into 14 lithological domain zones of Cu-Au-Fe mineralisation, based on lens lithology type. There are 9 mineralised lithological domain zones in the South Mineralised Zone and 5 in the North Mineralised Zone. The mineralised lithological domain zones were used as hard boundaries to select sample populations for data analysis and grade estimation. In the South Mineralised Zone hard boundaries between individual lenses were used in the grade estimation, while soft boundaries between the lenses within each domain zone were used in the North Mineralised Zone (refer to Figure 5).
Sample data was composited to 1m downhole lengths based on sample length frequency. Statistical analysis was undertaken on all mineralised zones and high grade cuts were applied based on a review of the histograms, probability plots and basic statistics.
Grade interpolation was undertaken using ordinary kriging ("OK") with an inverse distance to the power of two ("IDS") check estimate. Search ellipsoids were oriented to reflect mineralisation continuity directions identified from sample data analysis.
Block model definition parameters were reviewed with the primary block size of 10m E-W by 10m N-S by 5m vertical and sub-blocking to 2.5m by 2.5m by 2.5m.
Note the iron grade in the MRE is total iron. Although dominated by magnetite iron in the magnetite skarn, it does include other iron-bearing minerals including pyrite which will not be economically recoverable.
Cut-off Grades
Cut-off grades for reporting the Mineral Resource are 0.3g/t Au, in line with recommendations from RTG based on preliminary optimisation studies.
Classification Criteria
The Mineral Resource is classified as Indicated and Inferred, in accordance with the JORC (2012) Code, with geological evidence sufficient to assume geological and grade continuity in the Indicated volumes. Classification of the Mineral Resource estimate was carried out taking into account the geological understanding of the deposit, quality of the samples, density of data and drill hole spacing.
ABOUT RTG MINING INC
RTG Mining Inc. is a mining and exploration company listed on the main board of the Toronto Stock Exchange and Australian Securities Exchange Limited. RTG is focused on developing the high grade copper/gold/magnetite Mabilo Project and advancing exploration on the highly prospective Bunawan Project, both in the Philippines, while also identifying major new projects which will allow the Company to move quickly and safely to production.
RTG has an experienced management team (previously responsible for the development of the Masbate Gold Mine in the Philippines through CGA Mining Limited), and has B2Gold as one of its major shareholders in the Company. B2Gold is a member of both the S&P/TSX Global Gold and Global Mining Indices.
CAUTIONARY NOTE REGARDING FORWARD LOOKING STATEMENTS
This announcement includes certain "forward-looking statements" within the meaning of Canadian securities legislation. Statement regarding interpretation of exploration results, plans for further exploration and accuracy of mineral resource and mineral reserve estimates and related assumptions and inherent operating risks, are forward-looking statements. Forward-looking statements involve various risks and uncertainties and are based on certain factors and assumptions. There can be no assurance that such statements will prove to be accurate, and actual results and future events could differ materially from those anticipated in such statements. Important factors that could cause actual results to differ materially from RTG's expectations include uncertainties related to fluctuations in gold and other commodity prices and currency exchange rates; uncertainties relating to interpretation of drill results and the geology, continuity and grade of mineral deposits; uncertainty of estimates of capital and operating costs, recovery rates, production estimates and estimated economic return; the need for cooperation of government agencies in the development of RTG's mineral projects; the need to obtain additional financing to develop RTG's mineral projects; the possibility of delay in development programs or in construction projects and uncertainty of meeting anticipated program milestones for RTG's mineral projects and other risks and uncertainties disclosed under the heading "Risk Factors" in RTG's Annual Information Form for the year ended 31 December 2014 filed with the Canadian securities regulatory authorities on the SEDAR website at sedar.com.
QUALIFIED PERSON AND COMPETENT PERSON STATEMENT
The information in this release that relates to exploration results at the Mabilo Project is based upon information prepared by or under the supervision of Robert Ayres BSc (Hons), who is a Qualified Person and a Competent Person. Mr Ayres is a member of the Australian Institute of Geoscientists and a full-time employee of Mt Labo Exploration and Development Company, a Philippine mining company, an associate company of RTG Mining Limited. Mr Ayres has sufficient experience that is relevant to the style of mineralisation and type of deposit under consideration and to the activity being undertaken, to qualify as a Competent Person as defined in the 2012 Edition of the "Australasian Code for Reporting of Exploration Results, Mineral Resources and Ore Reserves" and to qualify as a "Qualified Person" under National Instrument 43-101 – Standards of Disclosure for Mineral Projects ("NI 43-101"). Mr. Ayres has verified the data disclosed in this release, including sampling, analytical and test data underlying the information contained in the release. Mr. Ayres consents to the inclusion in the release of the matters based on his information in the form and the context in which it appears.
The information in this release that relates to Mineral Resources is based on information prepared by or under the supervision of Mr Aaron Green, who is a Qualified Person and Competent Person. Mr Green is a Member of the Australian Institute of Geoscientists and is employed by CSA Global Pty Ltd, an independent consulting company. Mr Green has sufficient experience that is relevant to the style of mineralisation and type of deposit under consideration and to the activity which he is undertaking to qualify as a Competent Person as defined in the 2012 Edition of the "Australasian Code for Reporting of Exploration Results, Mineral Resources and Ore Reserves" and to qualify as a "Qualified Person" under National Instrument 43-101 – Standards of Disclosure for Mineral Projects ("NI 43-101"). Mr. Green has verified the data disclosed in this release, including sampling, analytical and test data underlying the information contained in the release. Mr Green consents to the inclusion in the release of the matters based on his information in the form and context in which it appears.
Appendix 1: Location of Infill Drill Holes Previously Not Reported
All drill holes included in the Mineral Resource Estimate have been previously reported. All collars were surveyed using a differential global positioning system ("DGPS") to centimetre accuracy.
SOURCE RTG Mining Inc.
Image with caption: "Figure 1. Schematic Long Section Showing Layering of Main Oxide Zones (CNW Group/RTG Mining Inc.)".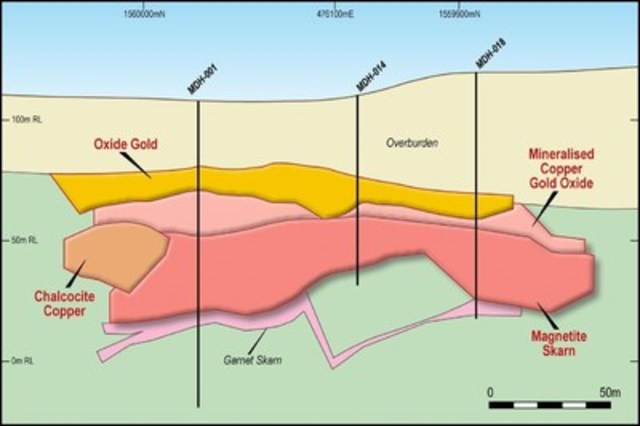
Image with caption: "Figure 2. Block Model Long Section Showing Distribution of Copper and Gold Grades (Southern Mineralised Zones) selected drill holes labelled. (CNW Group/RTG Mining Inc.)".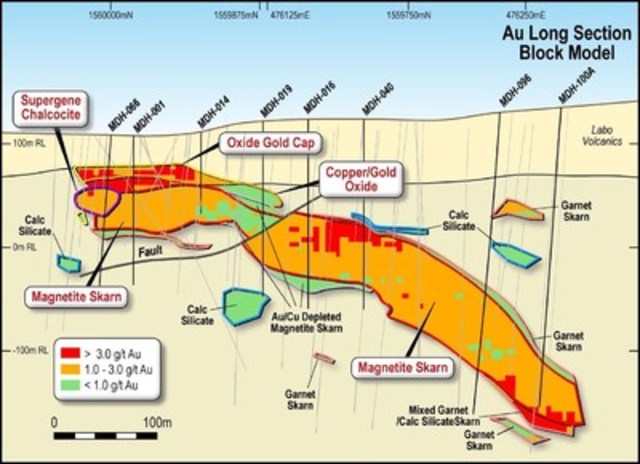
Image with caption: "Figure 2. Block Model Long Section Showing Distribution of Copper and Gold Grades (Southern Mineralised Zones) selected drill holes labelled. (CNW Group/RTG Mining Inc.)".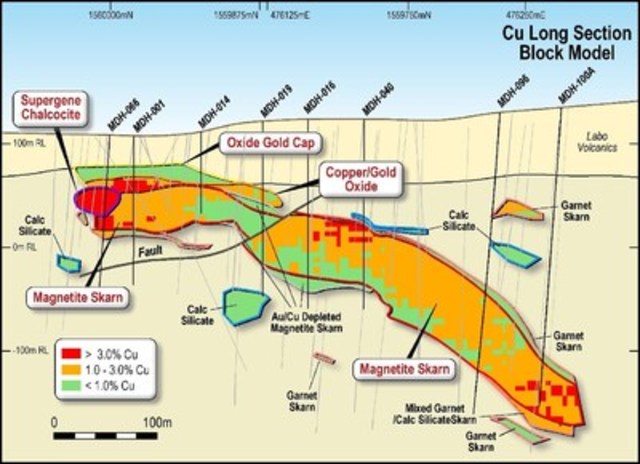
Image with caption: "Figure 3. Mabilo Deposit – Location Plan (CNW Group/RTG Mining Inc.)".
Image with caption: "Figure 4. Block Model Cross Sections Showing Distribution of Copper and Gold Grades at the southern end of the South Mineralised Zone. (CNW Group/RTG Mining Inc.)".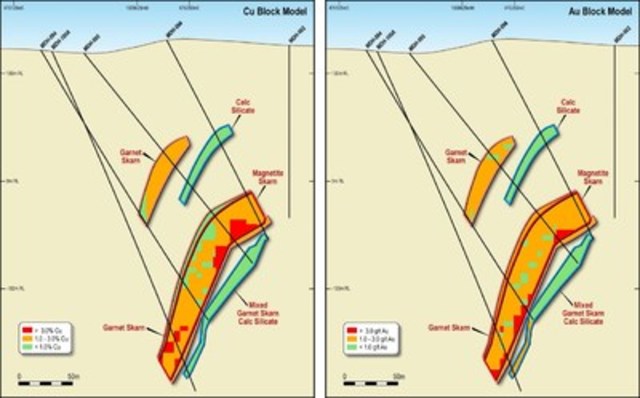
Image with caption: "Figure 5. Mabilo Deposit –Resource Wireframes (Oblique View ), some garnet skarn wireframes are not shown as not to obscure magnetite skarn. (CNW Group/RTG Mining Inc.)".